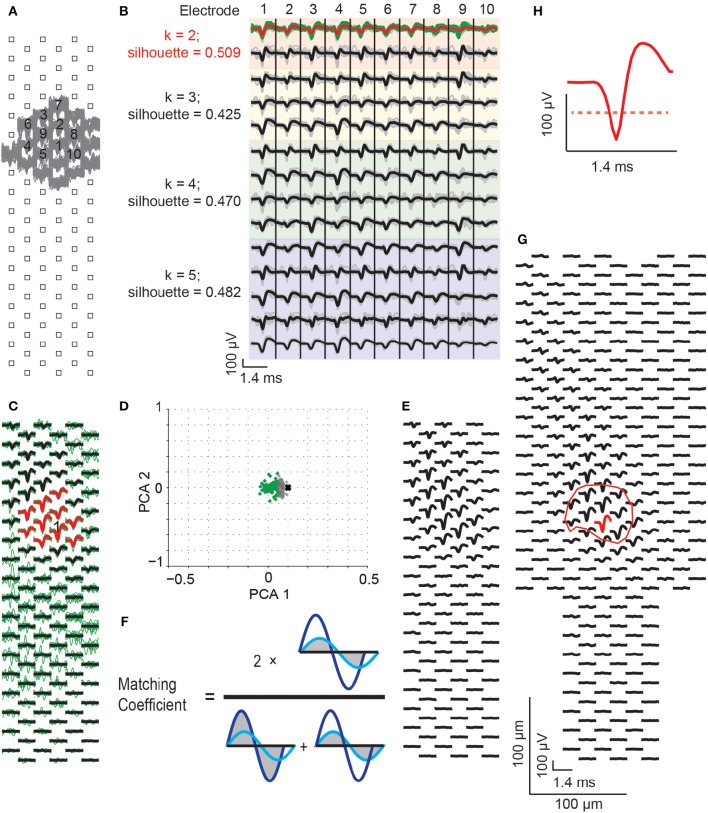
Figure 4.
Spike sorting procedure. (A) Raw spikes (gray traces), recorded from a block configuration, were identified via threshold detection. The electrode with the largest spikes was selected as the “core electrode” (labeled as electrode “1”), and the neighboring electrodes having the largest spikes were identified (gray traces). From all these electrodes, the 10 electrodes with the largest spikes were chosen for spike sorting. (B) Spike waveforms from the selected 10 electrodes were up-sampled by a factor of 6 in time (gray traces, median value in black). The waveforms were clustered with PCA and k-means while using different numbers of clusters (k = 2, 3, 4, and 5, in the colored panels). The silhouette scores were assessed to detect the best number of clusters to use, which was indicated by the largest silhouette values (here, the orange colored panels featuring 2 clusters). The selected cluster (green traces), with the largest spike at the core electrode, was chosen for generating the spike template (the median of the green traces, indicated as red trace). (C) From spikes in the selected cluster, a spike template was generated covering all electrodes in the respective configuration. The green traces are the waveforms that belong to the sorted neuron. Black and red traces are the spike template for this neuron, which is the median of the green traces. The red traces show the template for the 10 chosen electrodes in (A), and the core electrode is labeled with “1”. (D) All recorded spikes from the selected 10 electrodes were subtracted from the spike template to calculate residuals, in order to avoid the over-sorting issue from the spike-clustering step. The residuals were, again, clustered by PCA and k-means (k = 2). Green dots are the residuals that match the template, gray dots are the residuals that do not match the template. The black cross represents the negative template signals (i.e., zero minus the template, which is used to represent the location of a signal with only noise in the PCA space). (E) The spike template was re-calculated from the mean signal of the spikes matching the template (i.e., the spikes that generated the green dots in D). (F) The generated spike templates, termed “single-unit footprints,” were compared between overlapping configurations and within individual configurations in order to merge templates arising from the same neuron. This was done by calculating the matching coefficients for waveforms at all common configuration electrodes. The matching coefficient was calculated as 2 times the overlap area between the dark and light blue waveforms, divided by the sum of the two individual waveform areas. Areas are indicated with gray color. Based on the matching coefficient values, different templates were merged (see text for more details). (G) Final template of a sorted neuron across multiple configurations. Red is the core electrode, where the CF amplitude is determined. The respective electrode location defines the CF location. The red circle indicates the core area of the single-unit footprint, which was defined as CF area. (H) A zoom-in of the spike at the core electrode. The red dashed line marks the threshold of 50% of the largest negative signal amplitude within the footprint area, which has been applied to calculate the CF area. The scale bars in (G) also apply to (A,C,F).

