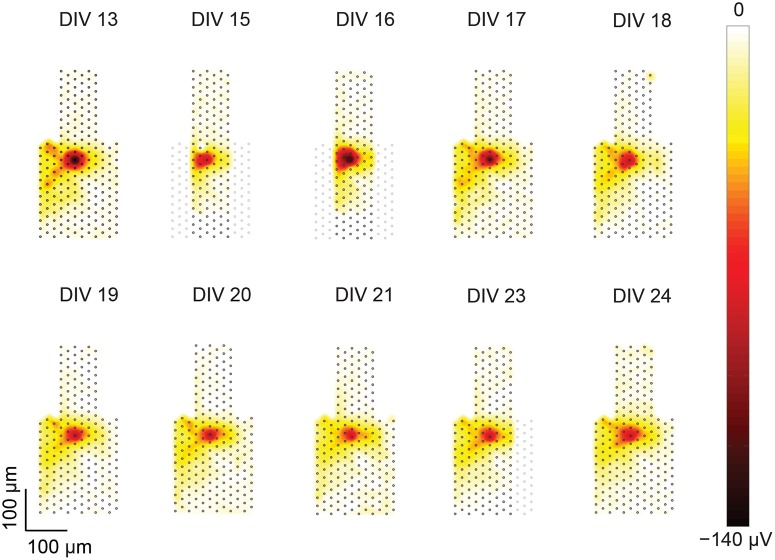
Figure 5.
Heat maps of a single-unit footprint tracked over multiple days. Footprints of a single unit from DIV 13–24 plotted as heat maps. The positions of the electrodes within the included recording blocks are represented as gray dots. For DIVs 15, 16, and 23 some of the electrodes are missing due to a recording artifact as described in the text. The shape of the central footprint area (red), however, was intact and remained stable over the recording duration.

