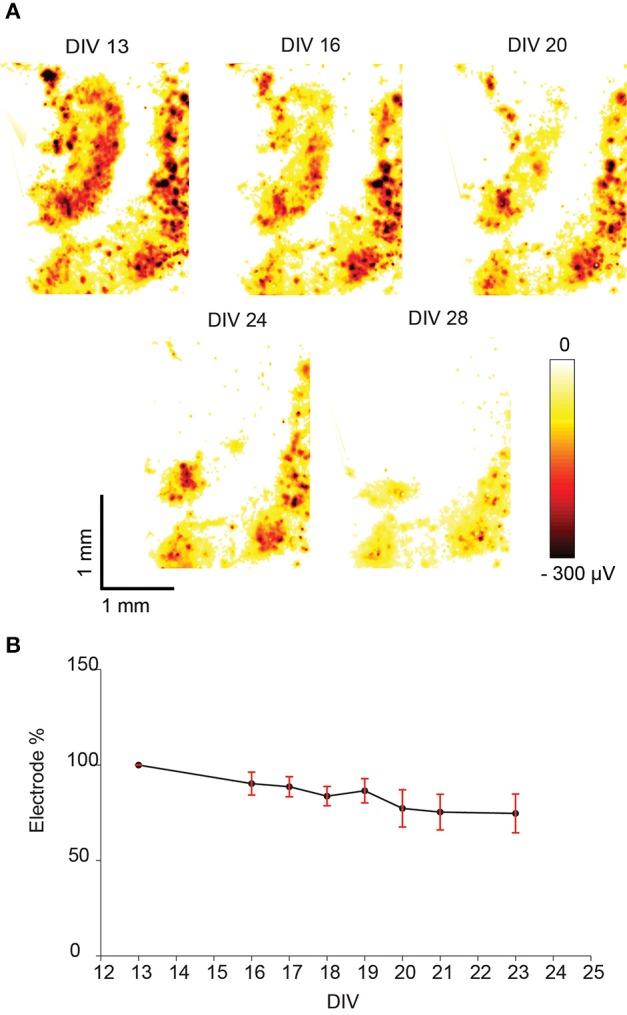
Figure 6.

Spontaneous activity of a hippocampal slice recorded with an HD-MEA during several days and displayed as “activity map.” (A) Example of spontaneous activity in a hippocampal slice culture observed over several days. The largest negative spike amplitudes produced by spontaneous activity are displayed as a heat map across the whole array, dark red color indicates the largest negative spike amplitude. (B) The percentage of electrodes that detected spikes exceeding the amplitude detection threshold (mean ± SEM, n = 5). The percentage was normalized to the number of electrodes detecting activity on the first day (100%). In all cases the percentage decreased with increasing cultivation time.
