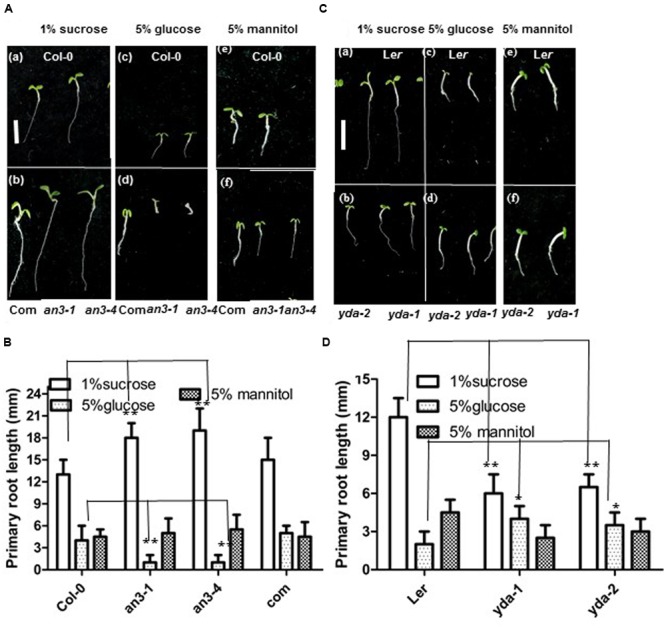
FIGURE 4.

AN3 and EMB71/YDA are involved in sugar metabolism and/or sugar signaling. (A) Representative 5-day-old Wild-type (Col-0) (a), complementary line (35S:AN3/an3-4) (b), an3-1 (b) and an3-4 (b) seedlings grown on solid MS medium with 1% sucrose; and 5-day-old Wild-type (Col-0) (c), complementary line (35S:AN3/an3-4) (d), an3-1 (d) and an3-4 (d) seedlings grown on solid MS medium with 5% glucose; and 5-day-old Wild-type (Col-0) (e), complementary line (35S:AN3/an3-4) (f), an3-1 (f), and an3-4 (f) seedlings grown on solid MS medium with 5% mannitol. Bar = 5.0 mm. Com, complementary line. (B) Bar graph exhibiting the difference in the root length between Wild-type (Col-0), an3-1, an3-4 and complementary line (35S:AN3/an3-4) seedlings grown on solid MS medium with 1% sucrose, 5%glucose, and 5% mannitol, respectively. Error bars represent SD (n = 20). Heteroscedastic t-test analysis showed significant differences (∗∗P < 0.01). Experiments were repeated three times with similar results (biological replicates). (C) Representative 5-day-old Ler (a) and yda-1, yda-2 (b) seedlings grown on solid MS medium with 1% sucrose; and 5-day-old Ler (c) and yda-1, yda-2 (d) seedlings grown on solid MS medium with 5% glucose; and 5-day-old Ler (e) and yda-1, yda-2 (f) seedlings grown on solid MS medium with 5% mannitol. Bar = 5.0 mm. (D) Bar graph exhibiting the difference in the root length between Ler, yda-1, and yda-2 seedlings grown on solid MS medium with 1% sucrose, 5% glucose, and 5% mannitol, respectively. Error bars represent SD (n = 20). Heteroscedastic t-test analysis showed significant differences (∗∗P < 0.01; ∗P < 0.05). Experiments were repeated three times with similar results (biological replicates).
