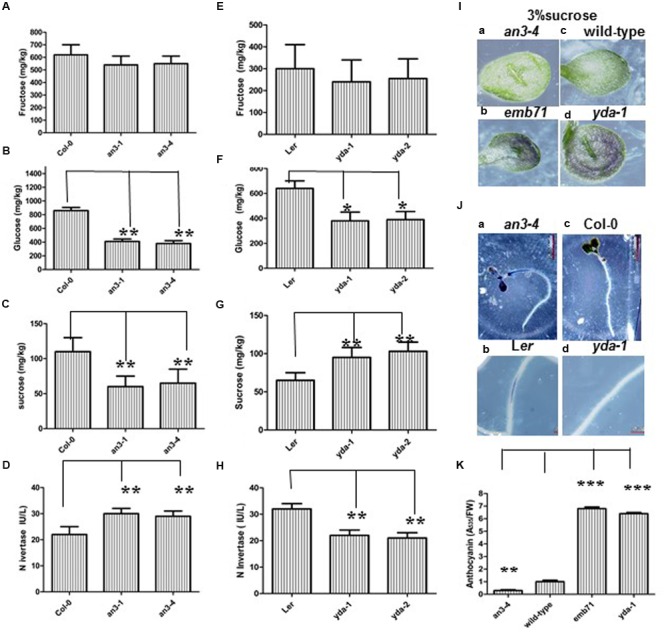
FIGURE 6.

Abnormal Anthocyanin Accumulation in an3 and yda Mutants is Caused by Abnormal Endogenous Sucrose Accumulation. (A–C) Bar graph exhibiting the difference of concentrations of hexose (glucose and fructose) (A,B) and sucrose (C) between Wild-type (Col-0), an3-1 and an3-4 seedlings. (D) Bar graph exhibiting the difference of the invertase activity between Wild-type (Col-0), an3-1 and an3-4 seedlings. IU/L indicates that seedling mixture per liter can produce the number of the invertase activity. (E–G) Bar graph exhibiting the difference of concentrations of hexose (glucose and fructose) (E,F) and sucrose (G) between Ler, yda-1 and yda-2 seedlings. (H) Bar graph exhibiting the difference of the invertase activity between Ler, yda-1 and yda-2 seedlings. IU/L indicates that seedling mixture per liter can produce the number of the invertase activity. The above seedlings were grown under long light (16L/8D) conditions on MS medium supplemented with 1% sucrose, respectively. Error bars represent SD (n = 3). Heteroscedastic t-test analysis showed significant differences (∗∗P < 0.01; ∗P < 0.05). Experiments were repeated two times with similar results (biological replicates). (I) Representative cotyledons of the 8-day-old an3-4 (a), emb71 (b), wild-type (c), and yda-1 (d) seedlings grown under long light (16L/8D) conditions on MS medium supplemented with 3% sucrose. (J) Representative nitroblue tetrazolium (NBT) precipitation in the 6-day-old an3-4 (a), Ler (b), Col-0 (c), and yda-1 (d) roots grown under long light (16L/8D) conditions on MS medium supplemented with 1% sucrose. Magnifications are the same. (K) Bar graph exhibiting the difference in the anthocyanin accumulation between the an3-4, Wild-type (Col-0), emb71 and yda-1 cotyledons grown under white light conditions on MS medium supplemented with 3% sucrose. Total amount of anthocyanin content in per gram fresh weight of Col-0 seedlings is 8.2. Wild-type (Col-0) is set as 1.0. Error bars represent SD (n = 3). Heteroscedastic t-test analysis showed significant differences (∗∗∗P < 0.001; ∗∗P < 0.01). Experiments were repeated two times with similar results (technical replicates).
