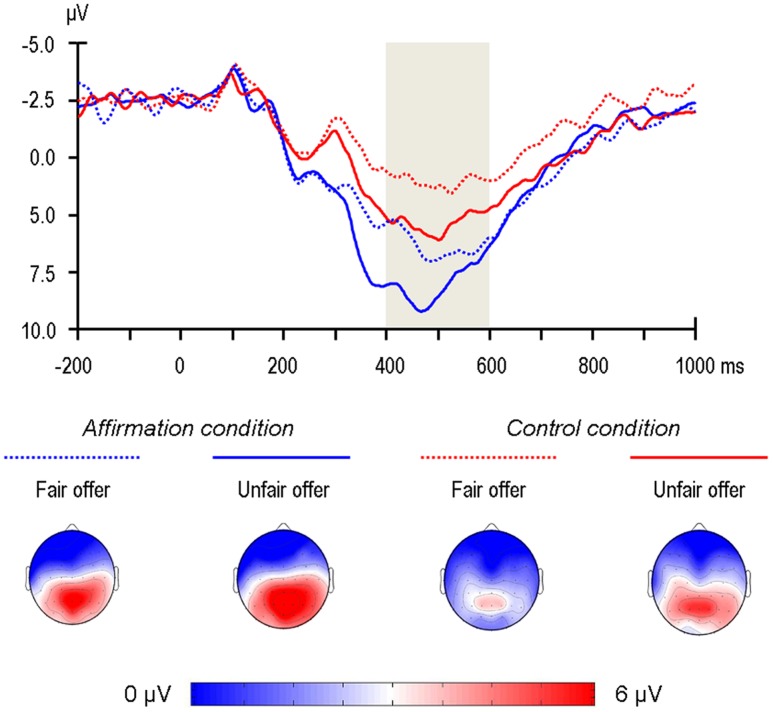
FIGURE 4.
Grand-average ERPs evoked by offer presentation at the Pz recording site, where the P3 component was measured. The time point 0 indicates the onset of offer presentation. The shaded gray areas indicate the 400–600 ms time window for the calculation of the mean value of the P3. The scalp topographies of each condition are presented beneath.

