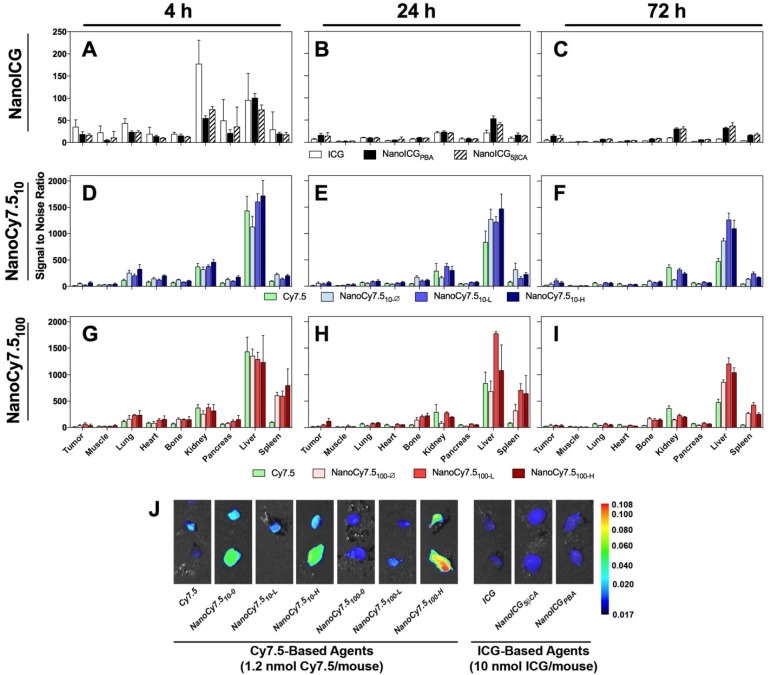
Figure 2.
Biodistribution of contrast agents at 4, 24, and 72 h after administration in MDA-MB-231 tumor bearing nude mice. N = 4-10 tumors, which depended on tumor growth in mice. Bars represent average pixel SNR (mean ± SD). For clarity, significant differences are described in the supplementary information. (A-C) NanoICG, (D-F) NanoCy7.5 based on 10 kDa HA, and (G-I) NanoCy7.5 based on 100 kDa HA at 4 h (left), 24 h (middle), and 72 h (right) after contrast agent injection. (J) NIR image of tumors harvested from mice. All tumors in J are presented with the same colormap to visualize differences between groups. Supplemental Figure 2 shows representative NIR images of all harvested organs.

