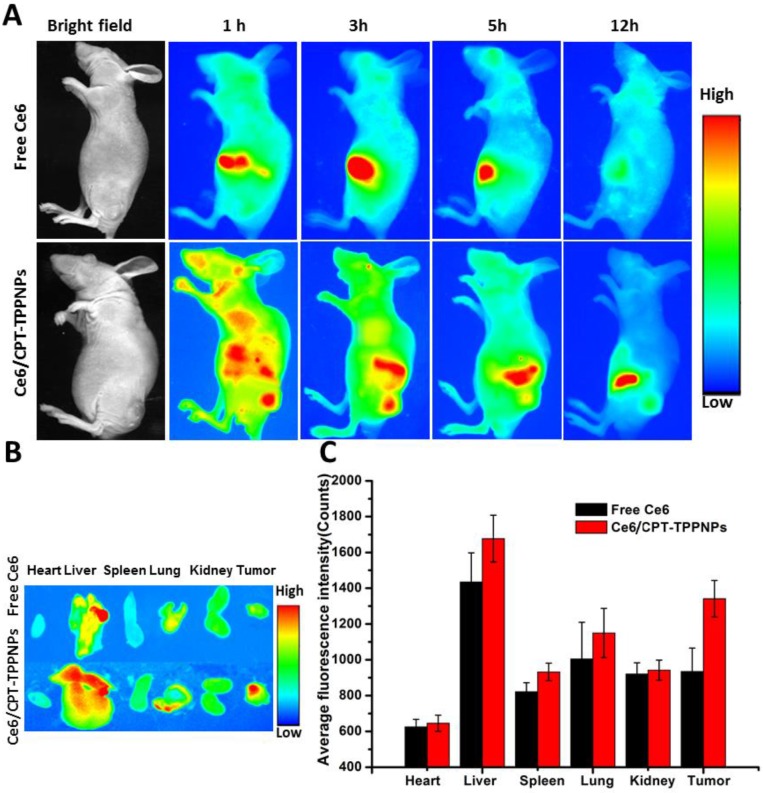
Figure 6.
In vivo biodistribution analysis on nude mice bearing NCI-H460 tumors after tail vein injection of Ce6/CPT-TPPNPs: (A) Time-lapse fluorescence images of nude mice. (B) Fluorescence images of excised major organs and tumors after injection of Ce6/CPT-TPPNPs or free Ce6 at 5 h. (C) Semiquantitativebiodistribution of free Ce6 or Ce6/CPT-TPPNPs in nude mice determined by the average Ce6 fluoresence intensity of organs 5 h post-injection. The data are shown as mean±SD.

