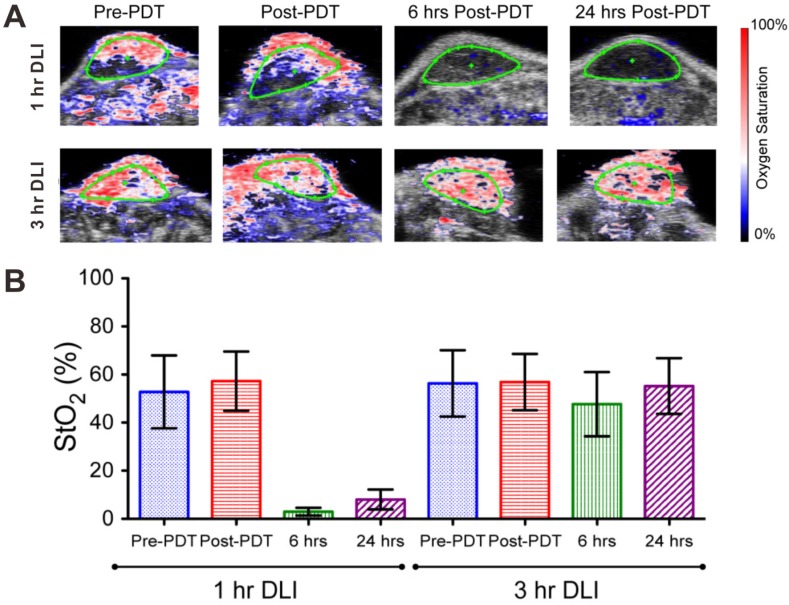
Figure 3.
(A) PA images of blood oxygen saturation (StO2) in 1 h drug-light-interval (DLI) group (up) and 3 h DLI group (down) at various time points (pre-PDT, post-PDT, 6 h and 24 h post-PDT). Blue and red signals represent hypoxic and oxygenated regions, respectively. (B) Mean StO2 values in 1 h DLI group and 3 h DLI group. Error bars indicate standard deviation. Reproduced with permission 104. Copyright 2015 Ivyspring International Publisher.

