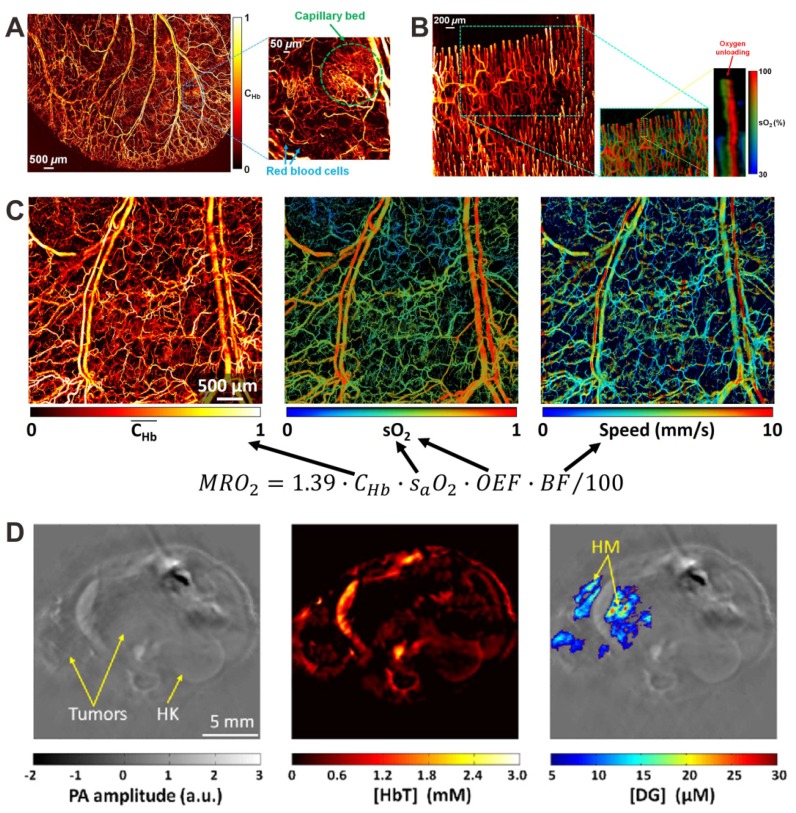
Figure 4.
(A) In vivo PA image of relative CHb in a living mouse ear, revealing the vascular anatomy. Reproduced with permission 19. Copyright 2011 Optical Society of America. (B) In vivo PA images of CHb and sO2 in human finger cuticle. Reproduced with permission 24. Copyright 2013 Biophysical Society. (C) In vivo PA images of CHb, sO2, and blood flow speed in a nude mouse ear. Reproduced with permission 25. Copyright 2015 Optical Society of America. (D) In vivo PA images of orthotopically implanted 786-O kidney tumors. Left: anatomical image; middle: total hemoglobin concentration (HbT) image; right: IRDye800-2DG concentration (DG) image; HK: healthy kidney; HM: hypermetabolic. Reproduced with permission 109. Copyright 2012 SPIE

