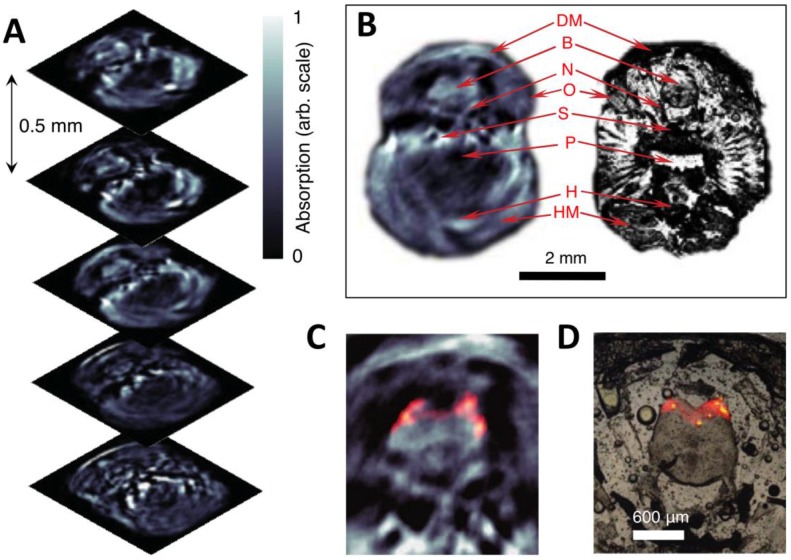
Figure 11.
Three-dimensional in vivo imaging through the brain of an adult mCherry-expressing transgenic zebrafish. (A) Five transverse PA imaging slices through the hindbrain area of a living zebrafish. (B) Example of an imaged slice (left) and its corresponding histological section (right); DM, dorsal fin musculature; B, hindbrain; N, lateral line nerve; O, operculum; S, skull bones; P, pharynx; H, heart; HM, hypobranchial musculature. (C) Multispectral PA tomography image of the brain with mCherry expression shown in color; (D) Corresponding fluorescent histology of a dissected fish at the hindbrain level. Figure adapted with permission from 66.

