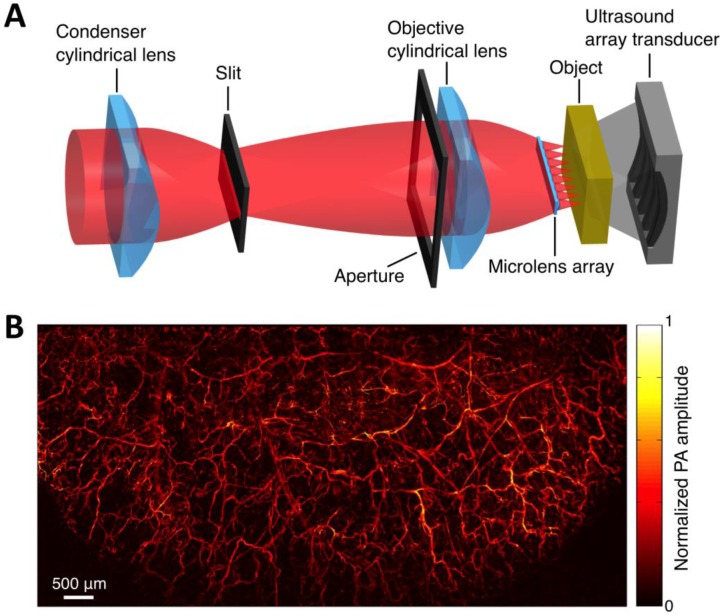
Figure 4.
Multifocal OR-PACT imaging of microvasculature in a mouse ear. (A) Schematic diagram of the multifocal OR-PACT system. (B) In vivo PA MAP (maximum projection amplitude) image of the mouse ear microvasculature. Figure adapted with permission from 25.

