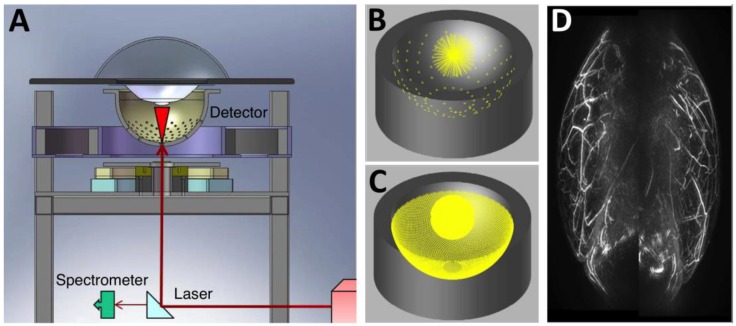
Figure 8.
Three-dimensional AR-PACT imaging of human breast. (A) Schematic diagram of a human breast PA mammography system, showing the laser beam entering the bottom of the detector bowl and illuminating the sample immersed in water and suspended above the bowl by a transparent tray. A beam splitter allows a portion of the laser beam to be monitored by a spectrometer for detection of laser power and wavelength. (B) The 128 radial projections captured by the detector geometry when data is collected for a single-bowl angular position. (C) The increased density of projections available as the bowl is rotated through 360 degrees. (D) Human breast PA maximum intensity projection image of a healthy volunteer (back-to-back image: left breast on right, right breast on left). Figure adapted with permission from 29, 30.

