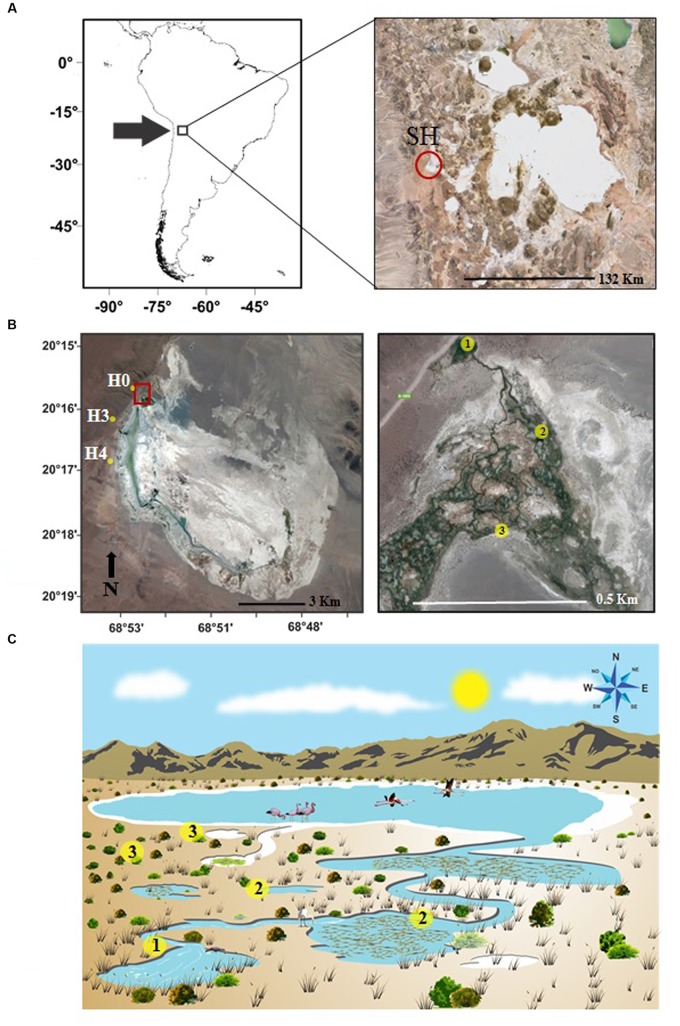
FIGURE 1.
(A) Location of the study area at Salar de Huasco (SH), Chile. (B) Distribution of sampled stations along Salar de Huasco on previously described subsystems H0, H3, and H4 (Dorador et al., 2008b). Details of the intricate water flow system are shown as station types: (1) ground sources stations, with no previous solar exposure, (2) running water and connected ponds stations, and (3) isolated ponds. (C) Conceptual diagram of the Salar de Huasco suggested for the water flow connectivity and microbial communities distribution: ground sources H0 and H3 represented by yellow circle (1), close and connected downstream stations H3-RW and H4-CP with yellow circle (2), isolated ponds closer to the main shallow lake with H3-IP, H4-IP, H4-VMP represented by yellow circle (3).

