FIGURE 3.
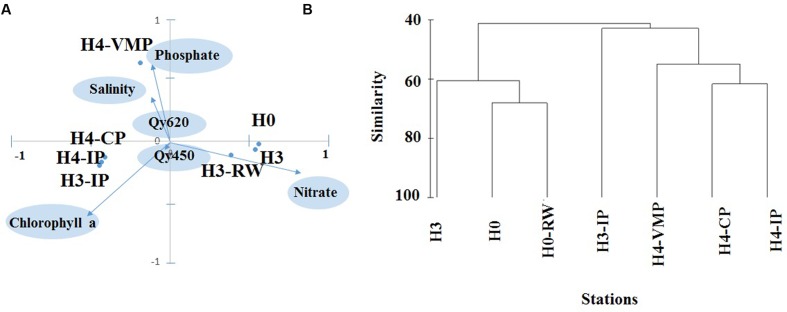
(A) Statistical multivariate principal component analysis to evaluate environmental similarity among stations including salinity, NO2-, PO43-, and NO3- concentrations, chlorophyll a concentration, photosynthetic efficiency of photosystem II for microalgae (Qy450) and cyanobacteria (Qy620). Stations are plotted according to their the first and second principal component (PC) scores; environmental variables are plotted according to PC1 and PC2 coefficients; because PC scores were in the range -100 to 100, they were divided by 100 and the two coordinate systems were overlaid at the same scale (ranging from -1 to 1 for both × and y-axis). (B) Group average cluster of station similarity based on microalgae abundance data across seven stations studied.

