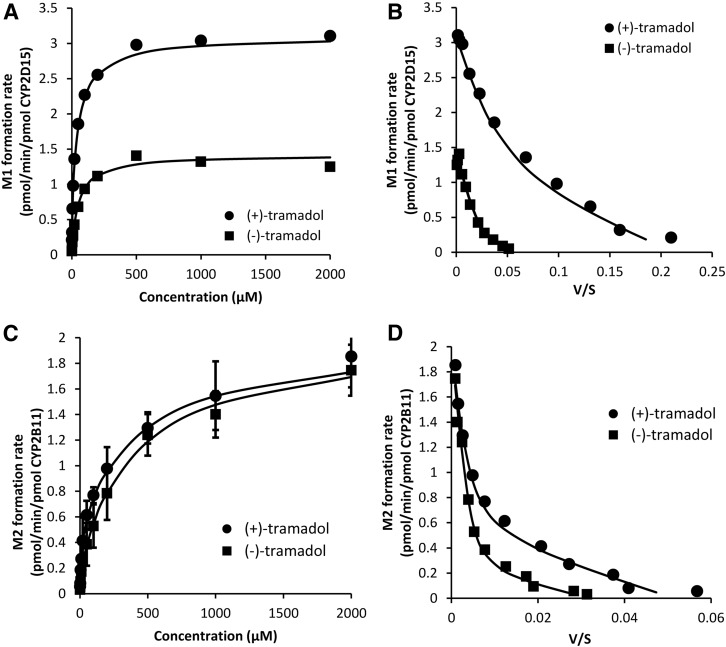
Fig. 6.
Michaelis–Menten enzyme kinetic plots of M1 formation by CYP2D15 (A) and M2 formation by CYP2B11 (C) from (+)-tramadol and from (−)-tramadol. Also shown are Eadie-Hofstee plots of these same data (B and D, respectively). Each data point represents the mean of three independent determinations performed in duplicate, and the curves represent the model of best fit to the data. V/S, XXX

