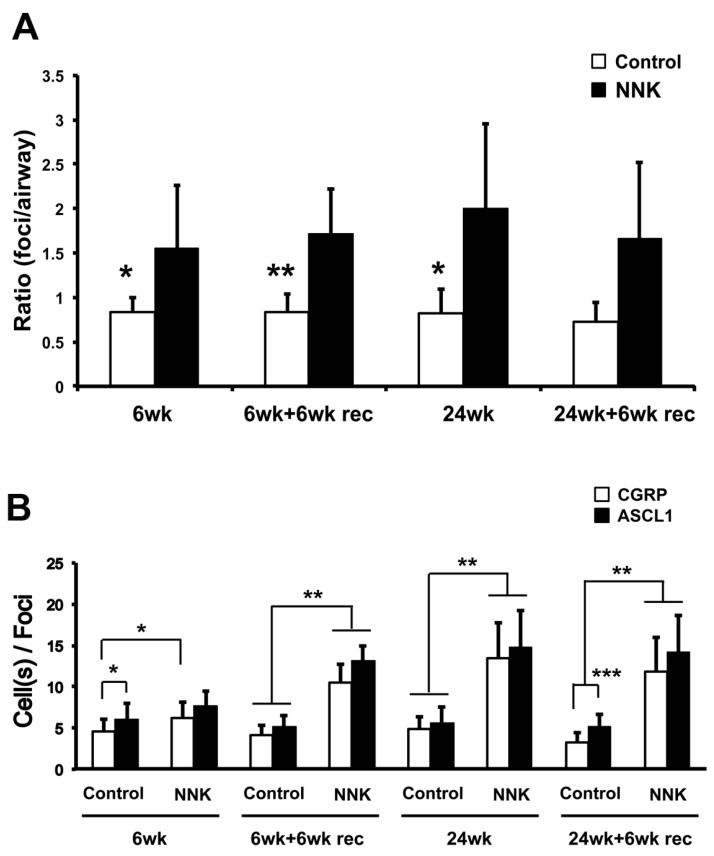
Figure 2.
Quantitative analysis of ASCL1-expressing foci among different groups of control and NNK-exposed hamsters. (A) Comparison of number of ASCL1-expressing foci per airway. Statistical significance is between solvent-only (control) vs. NNK-treated groups. (B) Number of ASCL1-expressing cells per foci (equivalent to foci size). Foci size was also determined by CGRP-positive cell numbers. 6wk: 6 weeks' solvent only (control) or NNK treatment; 6wk+6wk rec: 6 weeks' solvent only or NNK treatment, followed by recovery period of 6 weeks, denoted by “rec”; 24wk: 24 weeks' solvent only or NNK-treatment; and 24wk+6wk rec: 24 weeks' solvent only or NNK-treatment, followed by recovery period of 6 weeks. Mean ± SD is shown from N=6-10 animals per group. *: P<0.05, **: P<0.01, ***: P<0.001. Statistical analysis by unpaired t-test.

