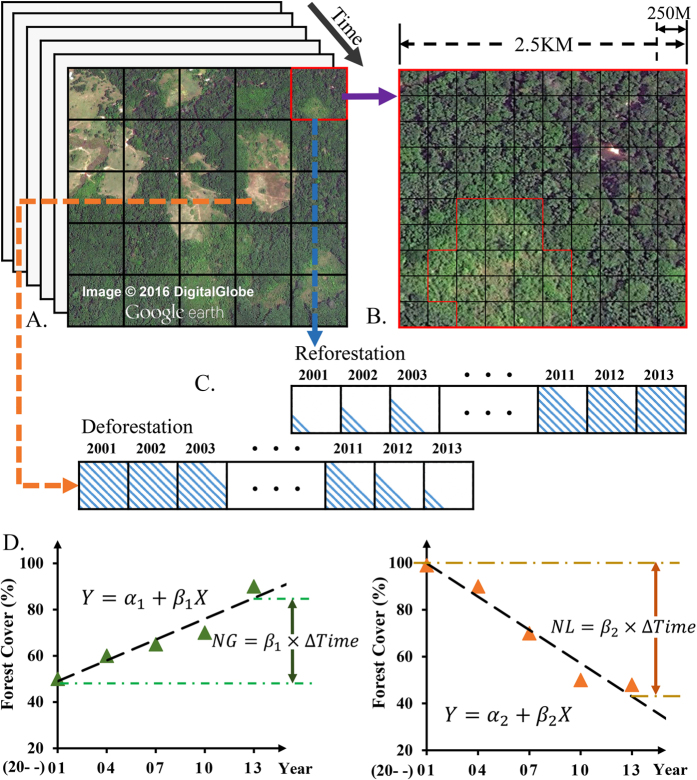
Figure 2. Illustration of land changes in the big grid and linear regression for each land cover type (e.g. forest land change).
Land cover in a series of big grids (A); Each big grid cell contains 10 × 10 land cover pixels (B); Forest cover dynamics as a time series in one big grid cell (C); Regression of forest cover on time (D). NG, net gain, NL, net loss.

