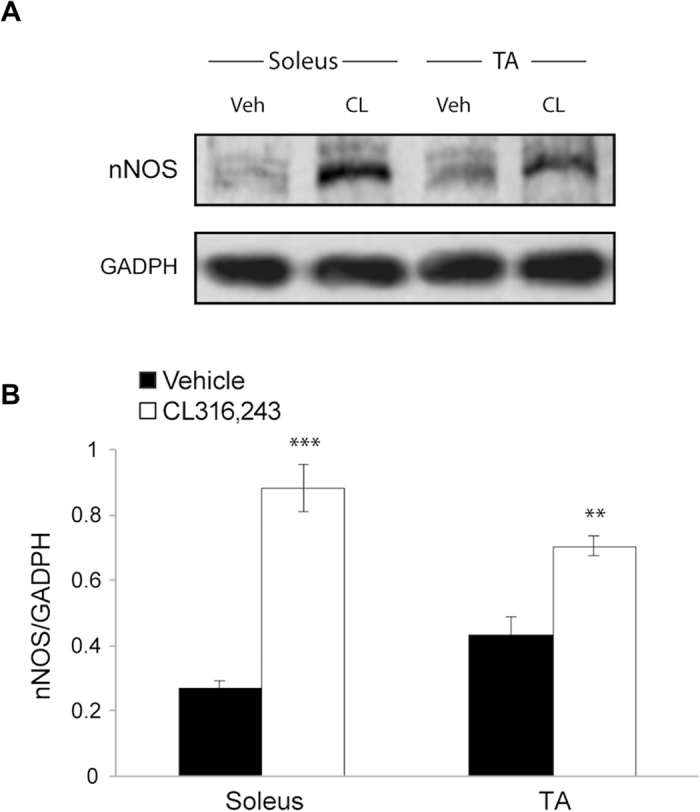
Figure 5. Effects of CL316,243 treatment on nNOS expression levels in skeletal muscles.

(A) Representative western blot showing the nNOS protein expression in TA and soleus skeletal muscles of mice treated with CL316,243 (CL) or vehicle (Veh). GADPH was used as internal loading control. (B) Densitometric quantification of protein shows significant increase of nNOS in both soleus and TA after treatment with CL316,243 (n = 5/5; for soleus unpaired t-test: t(8) = 8.41, p < 0.0001; for TA unpaired t-test: t(8) = 4.57, p = 0.002). **p < 0.01, ***p < 0.0001.
