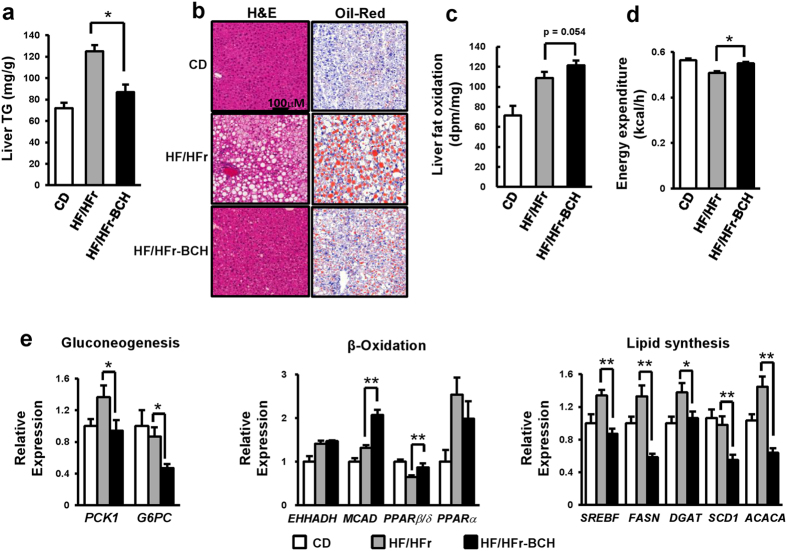
Figure 4. BCH protected HF/HFr-induced fatty liver in C57BL/6J mice.
(a) Livers were isolated from control diet (CD)-, high fat/high fructose (HF/HFr)-, or BCH-injected high fat/high fructose (HF/HFr-BCH)-fed mice. Liver triacylglycerol (TG) was isolated by Folch extraction method and the level of TG was then measured with a WAKO TG assay kit. (b) Liver tissues were stained with hematoxylin and eosin (H&E) or Oil-Red O. (c) Fat oxidation was determined through ex vivo oxidation assay (Supplementary Methods). (d) Energy expenditure was assessed by a comprehensive animal metabolic monitoring system (CLAMS). Metabolic parameters were measured over a 48 h period. The profile of average energy expenditure for each group was obtained every hour during a 24 h course. (e) Relative expressions of genes related to gluconeogenesis, beta-oxidation and lipid synthesis were determined through real time-PCR. Data were represented as means ± SEM of ten mice per group (n = 10 per group). *p < 0.05, **p < 0.01 vs. BCH-untreated HF/HFr group.

