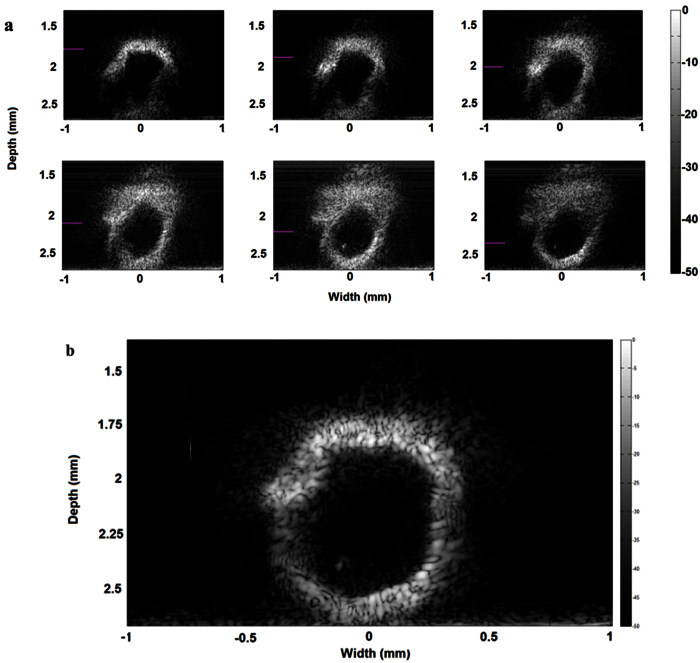
Figure 4. In vitro B/D-scan tissue images acquired by the 60-MHz f#0.6 SBAT.
(a) Rat aorta sub-images collected (5 μm lateral step) at different device-to-sample distances. The focus position is labeled with a purple bar. (b) The resultant aorta image, compounded with the sub-images (B/D-scan) shown in Fig. 3a, exhibits enhanced contrast and large depth of view.

