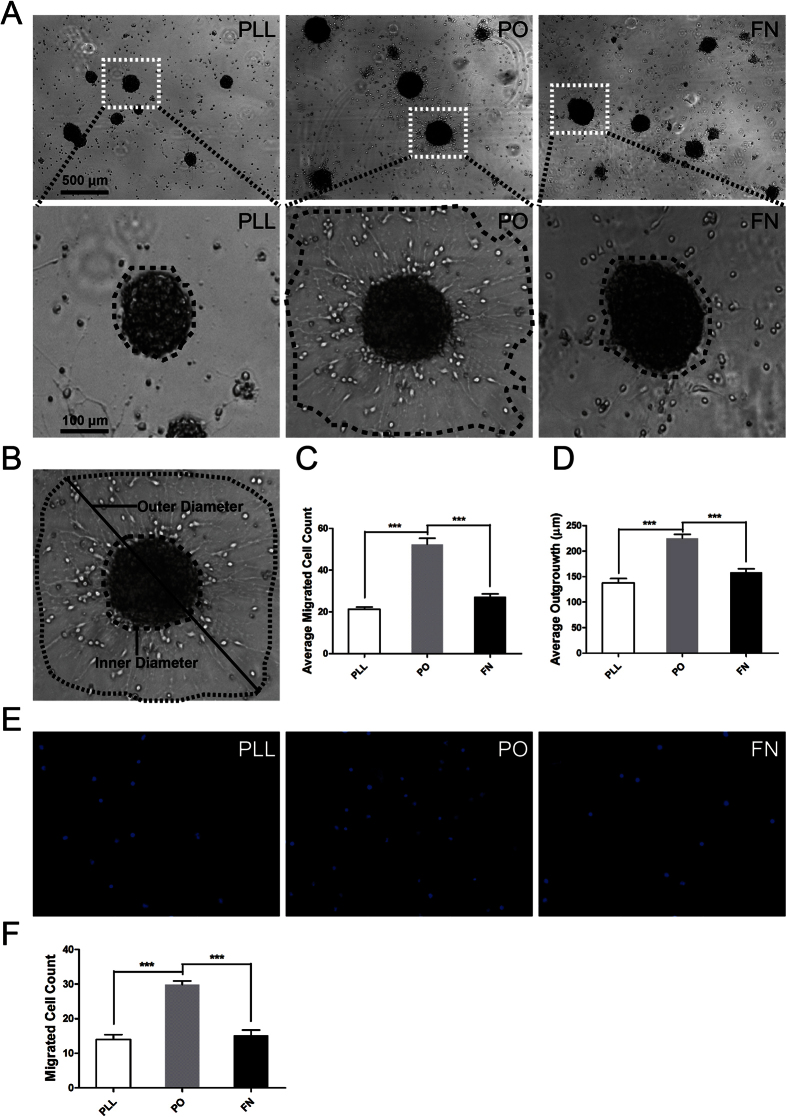
Figure 2. PO evidently enhanced migration of NSPCs.
(A) Neurospheres were plated in different substrates pre-coated 24-well plates and images were captured by phase contrast microscopy after 12 hours. Insets were magnified images from each photograph at low magnification. (B) NPSCs migration was determined by the longest outer diameter of neurosphere migration normalized to inner sphere diameter and reported in micron. (C) Summarized graph showed the number of migration cells from neurospheres on PLL, PO and FN. ***P < 0.01, one-way ANOVA followed by Tukey’s post hoc test (n = 6 for each group). (D) Quantitative analysis of migration distance from neurospheres on PLL, PO and FN respectively. ***P < 0.01, one-way ANOVA followed by Tukey’s post hoc test (n = 6 for each group). (E) Transwell assays to evaluated the migration potential of NSPCs on PLL, PO and FN. (F) Summarized graph indicated the number of migration cells from upper chambers to lower ones pre-coated with PLL, PO and FN. ***P < 0.01, one-way ANOVA followed by Tukey’s post hoc test (pooled data from five independent experiments). The data are presented as the mean ± SEM.

