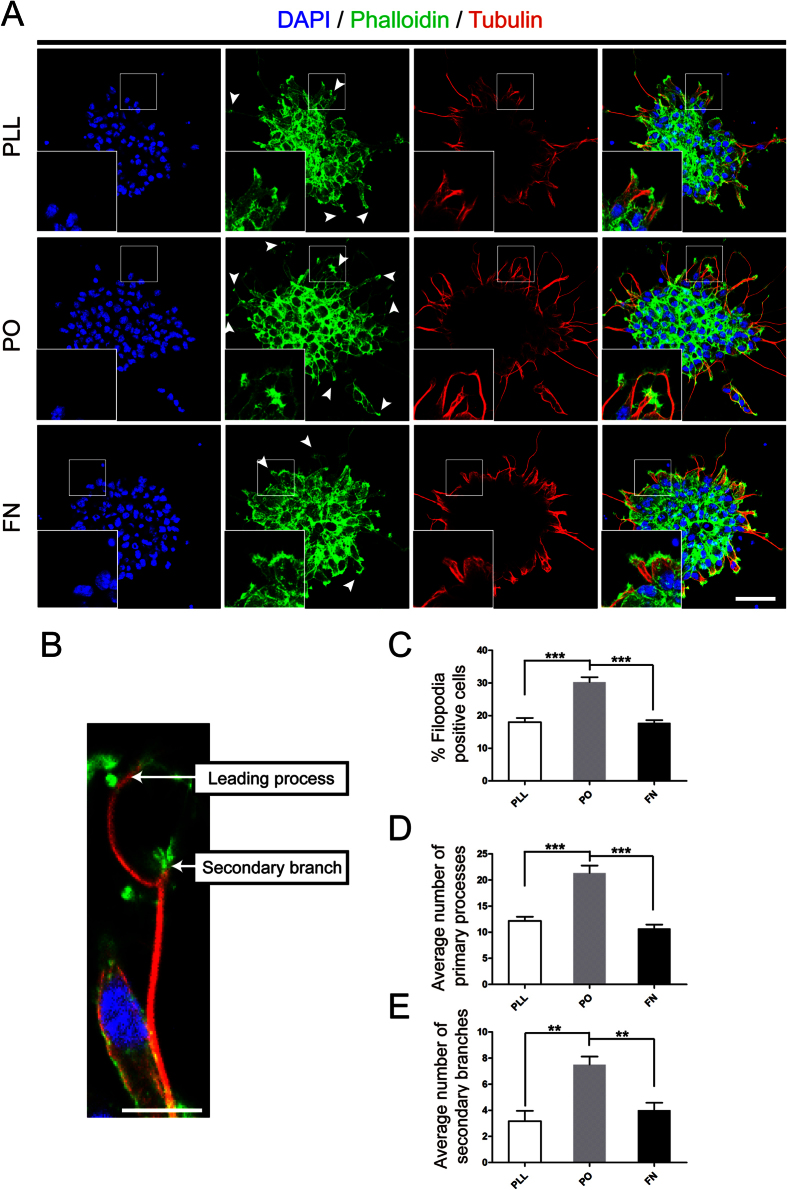
Figure 3. PO promoted filopodia formation.
(A) Phalloidin staining (green) assessed the nubmer of filopodia formation and tubulin immunostaining (red) images showed the cage-like microtubule structure in neurospheres growing on PLL, PO and FN. Cell nuclei were stained with DAPI in blue. Arrows indicated the standard filopodia formation in each group. Scale bar: 20 μm. (B) An example of phalloidin and tubulin-labeled NSPCs with a secondary branch and a leading process. Scale bar: 20 μm. (C) Bar graph demonstrated the percent of filopodia formation on PLL, PO and FN. ***P < 0.01, one-way ANOVA followed by Tukey’s post hoc test (n = 6 for each group). (D) Quantitative analysis of average number of primary leading processes on PLL, PO and FN respectively. ***P < 0.01, one-way ANOVA followed by Tukey’s post hoc test (n = 6 for each group). (E) Quantitative analysis of average number of secondary branches on PLL, PO and FN respectively. **P < 0.05, one-way ANOVA followed by Tukey’s post hoc test (n = 6 for each group).

