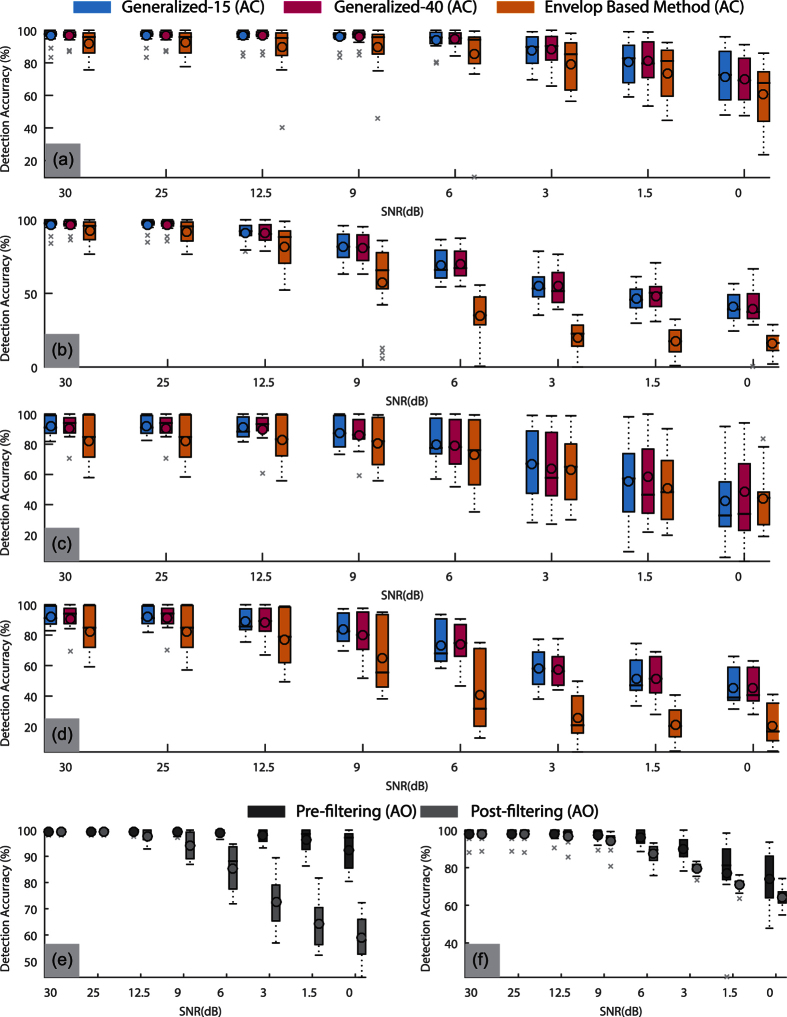
Figure 7. Demonstration of the effect of varying levels of Gaussian noise on AO/AC peak detection accuracy with box plots.
(a) AC detection accuracy in supine trials with pre-filtering noise, (b) AC detection accuracy in supine trials with post-filtering noise, (c) AC detection accuracy in seated trials with pre-filtering noise (d) AC detection accuracy in seated trials with post-filtering noise, (e) AO detection accuracy in supine trials with both pre-filtering and post-filtering noise and (f) AO detection accuracy in seated trials with pre-filtering and post-filtering noise.

