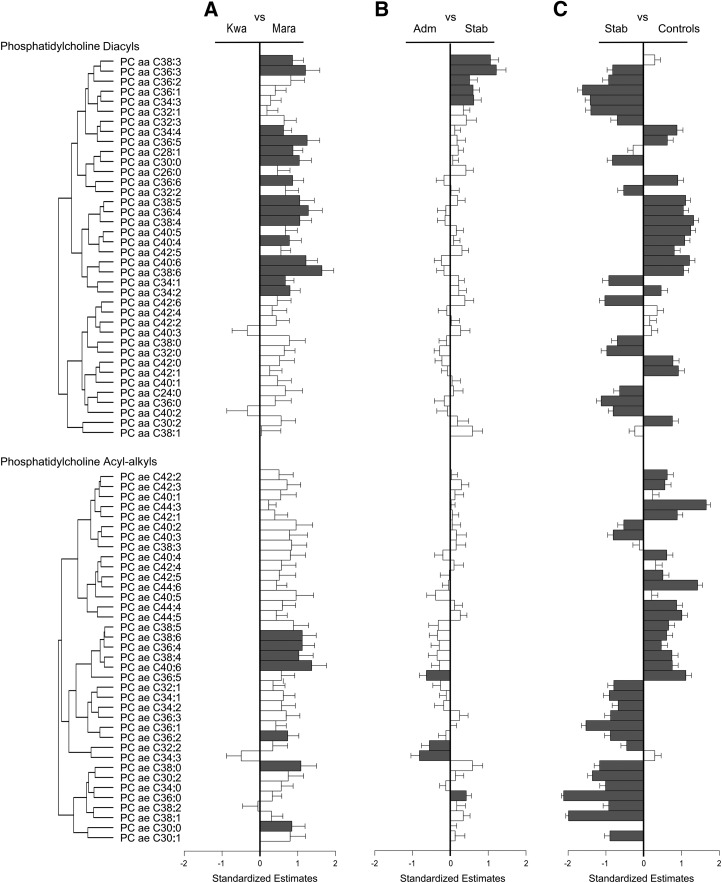
FIGURE 3.
Serum metabolites of phosphatidylcholine diacyls and acyl-alkyls were compared between children with kwashiorkor and those with marasmus (A), children with SAM at admission and children after clinical stabilization (B) and children after nutritional stabilization and community controls (including both stunted and nonstunted children) (C). Standardized estimates and SEs were obtained from either mixed linear regression models that accounted for age, sex, and repeated measures (i.e., when comparing patients at admission and after nutritional stabilization) or linear regression models adjusted for age and sex. Group numbers are as follows: kwashiorkor, n = 21; marasmus, n = 18; admission, n = 39; stabilization, n = 40; community controls, n = 157. Metabolites are ordered on the basis of Pearson hierarchal clustering of all metabolites within each compound class from patients with SAM at admission and after nutritional stabilization, and this clustering is represented by the dendrograms. Scaled estimates and SEMs allowed for the comparison of effect sizes across different metabolites. The direction of the bar indicates which diagnostic group had higher metabolite concentrations, and the metabolites that reached false discovery rate–adjusted significance are labeled in dark gray. All metabolite abbreviations are detailed in Supplemental Tables 1–8. Adm, admission; Kwa, kwashiorkor; Mara, marasmus; SAM, severe acute malnutrition; Stab, stabilization.

