Figure 2.
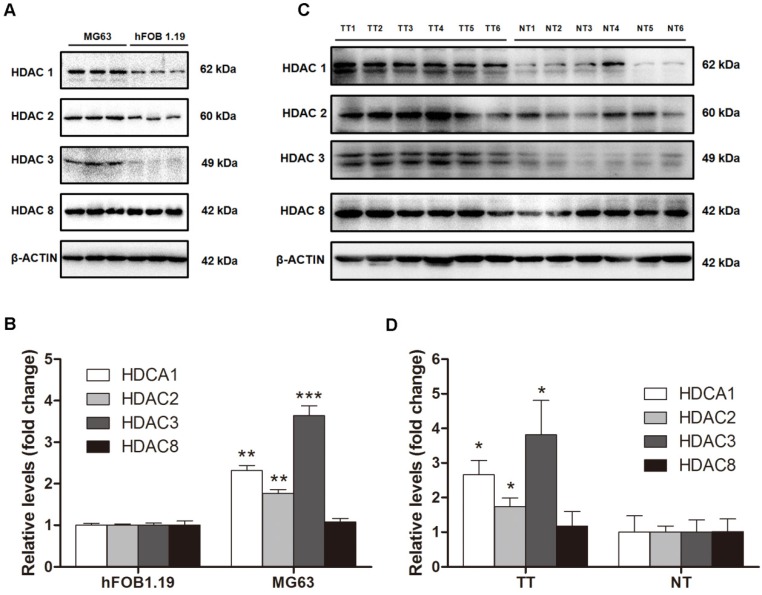
The protein levels of class I HDACs in osteosarcoma cells and human osteosarcoma tissues. (A) The protein levels of class I HDACs in MG63 cell line comparied with that in hFOB 1.19 cell line. (B) The density of the western blots bands shown in (A) was quantified using Gene Tools software. Data are presented as means ± S.E.M. from 3 independent experiments. **, P < 0.01 vs. hFOB 1.19; ***, P < 0.001 vs. hFOB 1.19. (C) The protein levels of class I HDACs in human osteosarcoma tissues comparied with that in adjacent normal tissues. (D) The density of the western blots bands shown in (C) was quantified using Gene Tools software. N=6 patients. *, P < 0.05 vs. NT. TT, tumor tissue; NT, normal tissue.

