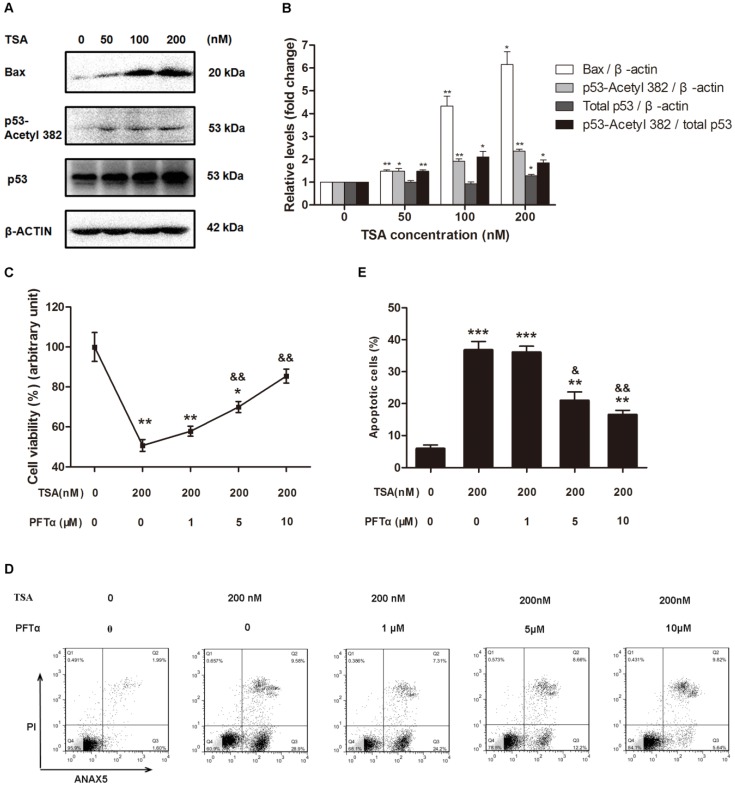
Figure 5.
TSA promoted osteosarcoma cell apoptosis through p53 signal pathway activation. (A) Western blots performed after MG63 cells were incubated with TSA at various concentrations (0, 50, 100, 200 nM) for 24h. (B) The density of the western blots bands shown in (A) was quantified using Gene Tools software. Data are presented as means ± S.E.M. from 3 independent experiments. *, P < 0.05 vs. 0 nM; **, P < 0.01 vs. 0 nM. (C) Cell viability was measured after TSA and PFTα co-treatment. MG63 were exposed to TSA and various concentrations of PFTα (1, 5, 10μM) co-treatment compared with TSA treatment alone for 24h. Data are presented as means ± S.E.M. from 3 independent experiments. *, P < 0.05 vs. MG63 cells without TSA or PFTα treatment; **, P < 0.01 vs. MG 63 cells without TSA or PFTα treatment; &&, P < 0.01 vs. MG63 cells with TSA treatment alone. (D) Flow cytometry analysis of ANXA5 and propidiumiodide staining of MG63 cells with TSA and various concentrations of PFTα (1, 5, 10μM) co-treatment, compared with TSA treatment alone. (E) Quantification analysis of apoptotic cells in (D) (both upper- and lower- right quadrants in representative dot plots as shown). Data are presented as means ± S.E.M. from 3 independent experiments. **, P < 0.01 vs. MG63 cells without TSA or PFTα treatment; ***, P < 0.001 vs. MG63 cells without TSA or PFTα treatment; &, P < 0.05 vs. MG63 cells with TSA treatment alone. &&, P < 0.01 vs. MG63 cells with TSA treatment alone.

