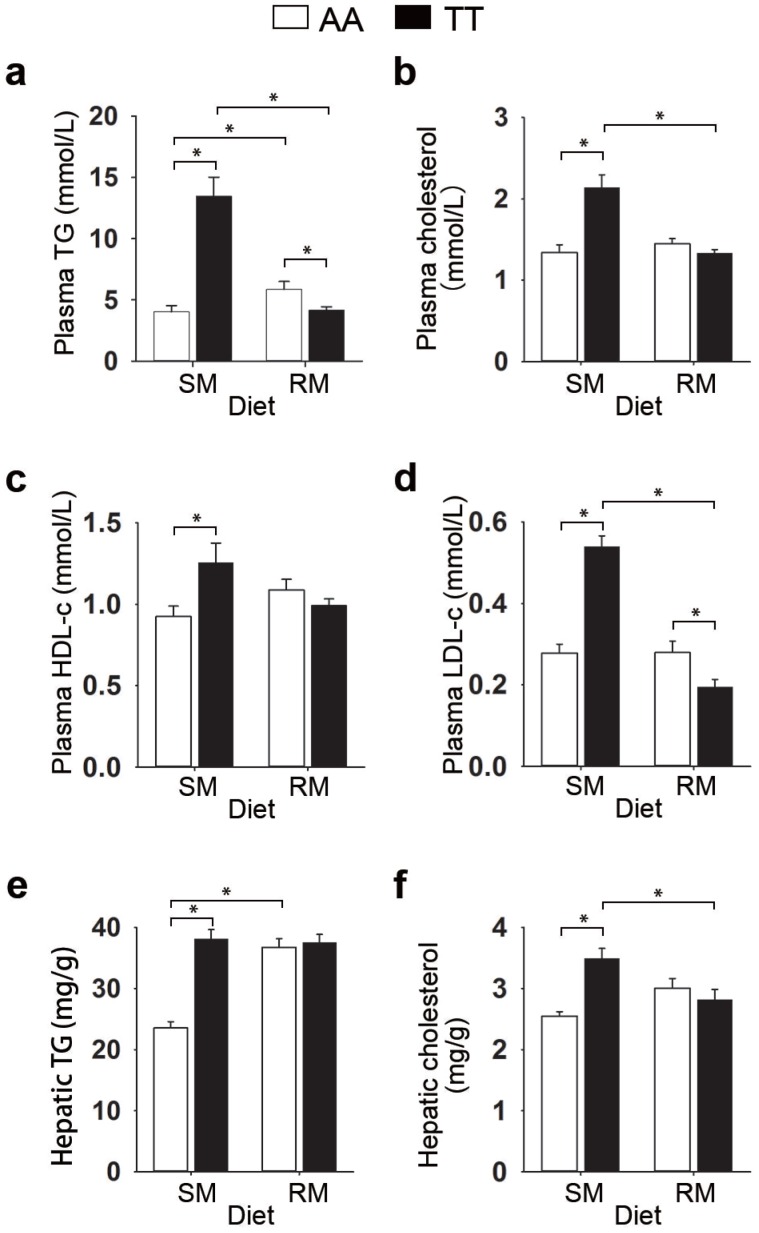
Figure 3.
Effect of the T329S genetic variation in FMO3 on plasma and liver lipids in birds. (a-d) Data are the mean of 6 replicates, and 3 birds from each replicate were analyzed, (e-f) Liver samples from hens was analysed, n = 6 birds/group. (a) Plasma total triglyceride (TG) levels. (b) Plasma cholesterol levels. (c) Plasma high-density lipoprotein cholesterol levels. (d) Plasma low-density lipoprotein cholesterol levels. (e) Hepatic total triglyceride levels. (f) Hepatic cholesterol levels. Data are presented as mean ± SEM. Significance was measured with student's t-test. *P < 0.05.

