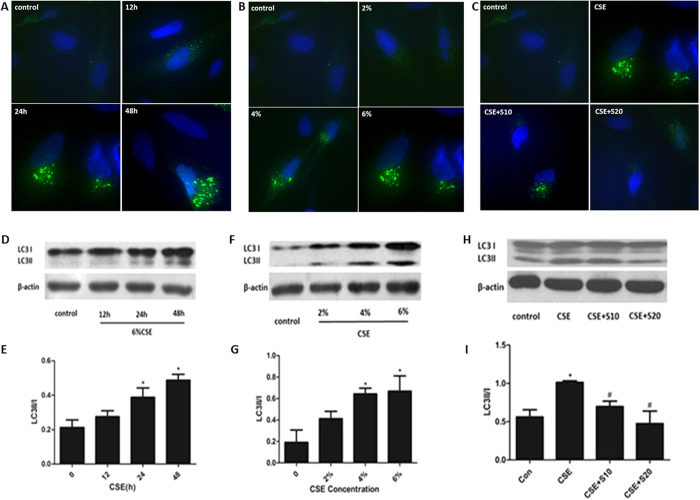
Figure 2. Autophagy activation in response to CSE and silymarin treatment.
Beas-2B cells were treated with 6%CSE for different time period, indicated concentrations of CSE for 24 h or both 6%CSE and silymarin (10 μM, 20 μM) for 24 h. Formation of pEGFP-LC3 puncta in Beas-2B cells was analyzed by immunofluorescence under fluorescence microscopy (×400) (A–C). Expressions of LC3I and LC3II were measured by Western Blot (D,F,H). Densitometry was performed and the ratio of LC3II/I were calculated (E,G,I). Results are representative of three independent experiments. Values are expressed as mean ± SEM (n = 3). *P < 0.05 with respect to the control group; #P < 0.05 with respect to the CSE-exposed group. S, silymarin.

