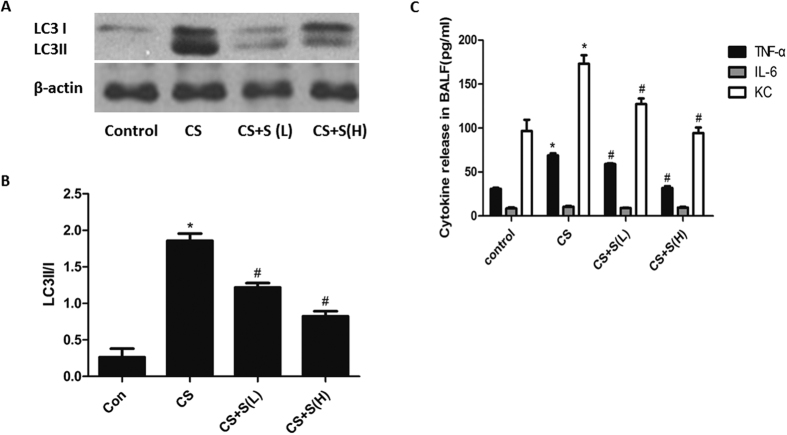
Figure 7. Effect of silymarin on autophagy activation and inflammatory cytokine release in mice lungs.
(A) Expressions of LC3I and LC3II were measured by Western Blot. (B) Densitometry was performed and the ratio of LC3II/I were calculated. (C) The secretion of TNF-α, IL-6 and KC in BALF were detected by ELISA. Results are representative of three independent experiments. Values are expressed as mean ± SEM (n = 3). *P < 0.05 with respect to the control group; #P < 0.05 with respect to the CSE-exposed group.

