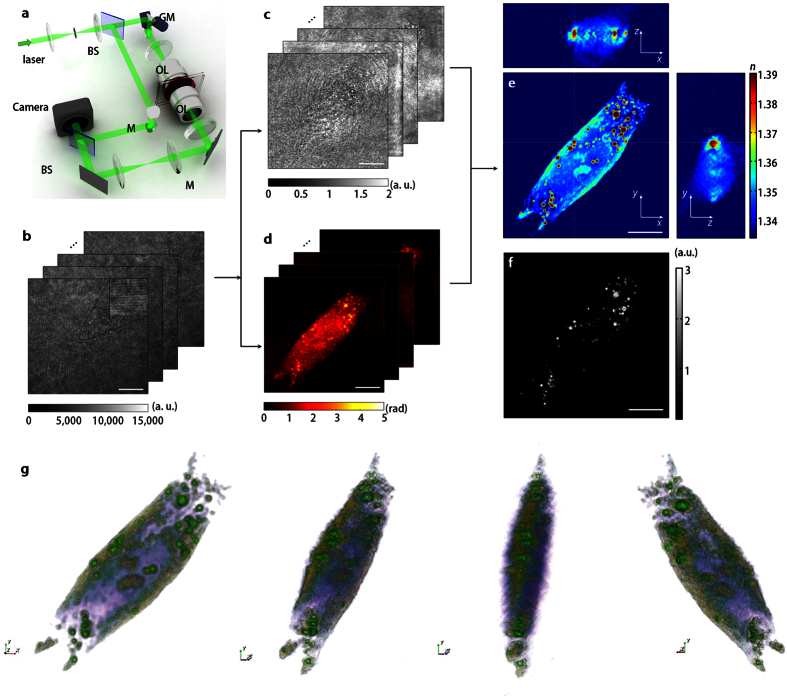
Figure 1. Schematic diagram of optical diffraction tomography optical diffraction tomography for label-free 3-D imaging of LDs.
(a) Experimental set up. BS: beam splitter, GM: galvanomirror, M: mirror, OL: objective lens. (b) Measured holograms of a hepatocyte (Huh-7) with various incident angles of illumination. The inset shows the enlarged view of the hologram indicated as a black box, which exhibits spatially modulated fringes. (c,d) Retrieved amplitudes (c) and phases (d) of the sample illuminated from various incident angles. (e) The cross-sectional slices of the 3-D RI distribution of the sample along the x-y, y-z, and x-z planes. (f) A deconvoluted fluorescence image of LDs stained with Nile Red. The scale bars indicate 10 μm. (g) 3-D rendered isosurface image of 3-D RI distribution from various viewing angles. See also Supplementary Movie 1.

