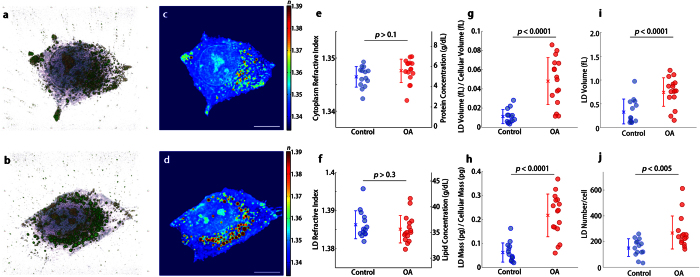
Figure 2. Quantitative analysis for LD formation in hepatocytes under oleic acid treatment.
(a,b) 3-D rendered isosurface image of 3-D RI distribution of (a) an untreated and (b) OA treated hepatocyte. See also Supplementary Movie 2 and 3. (c,d) Cross-sectional slice images of 3-D RI distribution of (a) the untreated and (b) OA treated hepatocyte. The scale bars indicate 10 μm. e-j, Quantitative analysis of (e) RI of cytoplasm, (f) RI of LDs, (g) the ratio of LD volume to cell volume, (h) the ratio of LD mass to cellular dry mass, (i) volume of individual LDs, and (j) number of LDs in untreated (n = 14) and OA-treated hepatocytes (n = 16).

