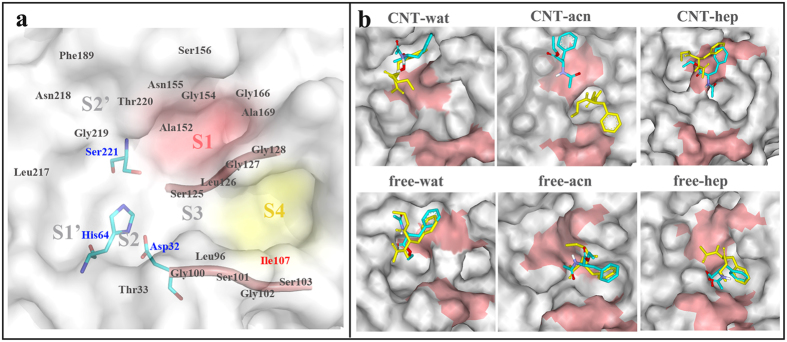
Figure 5. Structure of subtilisin active region and substrate binding modes after docking and MD simulations.
(a) Schematic of subtilisin active region (including catalytic triad and substrate binding pockets). The two β-strands (Gly100-Tyr103, and Ser125-Gly128) and catalytic triad are displayed in cartoon and stick styles, respectively. (b) Selected binding mode of substrate based on the docking result is colored by yellow in stick style. The substrate conformation after 20-ns MD simulation is colored by element in stick style. Red and gray denote the residues of the two β-strands and the other residues around the two β-strands, respectively.

