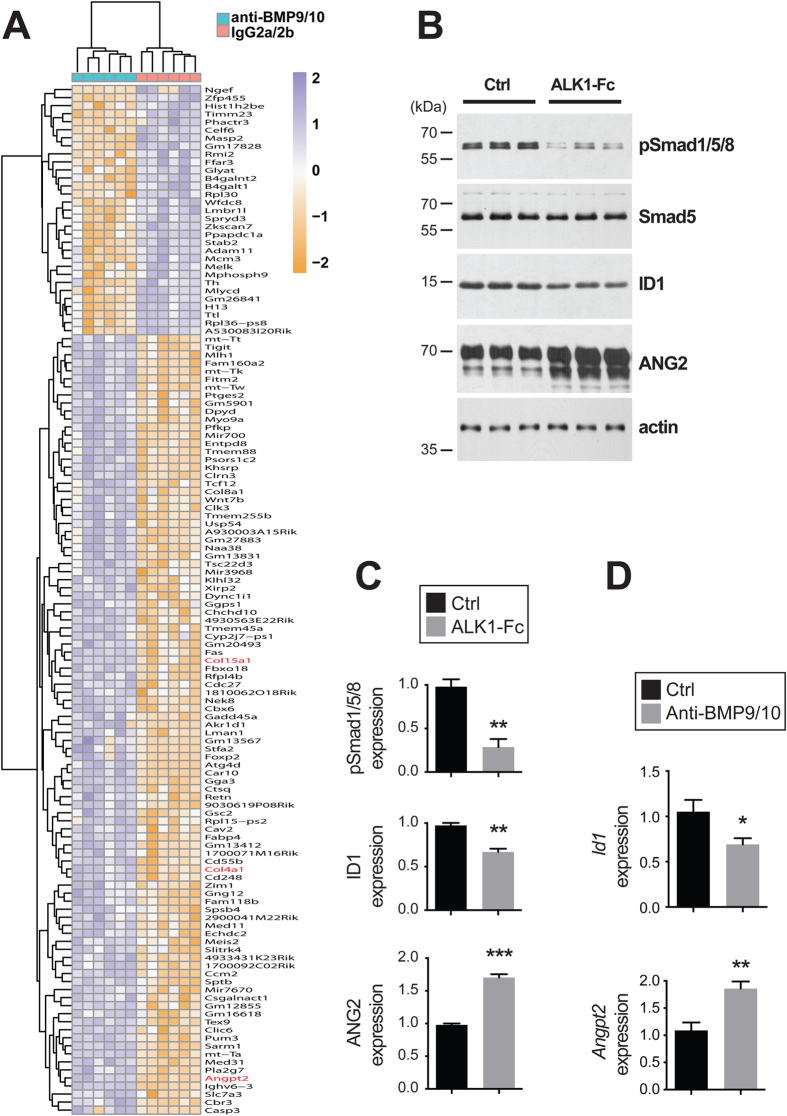
Figure 4. Gene expression changes in BMP9/10-immunoblocked retinas and ALK1-Fc-treated HUVECs.
(A) RNA-Seq heat map displaying differently expressed genes in mouse whole retinas following transmammary transfer of anti-BMP9/10 or control IgG2a/2b Abs (n = 6 pups per group from 1 dam). (B) HUVECs were treated or not (Ctrl) with ALK1-Fc (1 μg/mL, 24 h). Cell extracts were then analyzed by WB using Abs directed against the indicated proteins. (C) Densitometric analyses and quantification of phospho-Smad1/5/8, ID1, and ANG2 relative levels in three independent experiments as in (B). (D) ECs isolated from retinas of pups fed for 3 days by dams injected on P3 with control IgG2a/b Abs (Ctrl) or BMP9/10 blocking Abs (anti-BMP9/10) were analyzed for Id1 and Angpt2 mRNA levels by RT-qPCR. The results are expressed as relative levels of the control condition (n = 3 determinations, n = 6 pups per group from 1 dam). Data in (C,D) are mean ± s.e.m.; ***P < 0.001, **P < 0.01, *P < 0.05, unpaired Student’s t-test.

