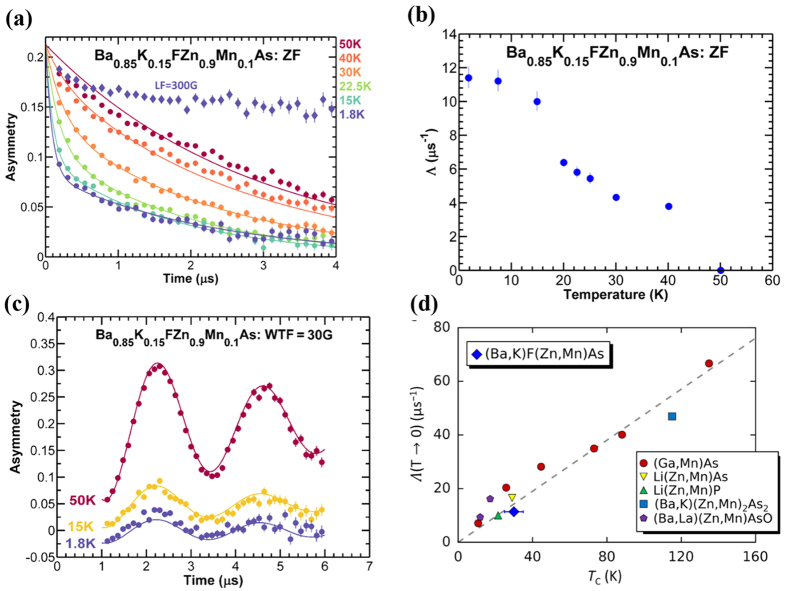
Figure 3. Results of μSR measurements of (Ba0.85K0.15)F(Zn0.9Mn0.1)As.
(a) Zero-field μSR spectra at various temperatures. The colored points represent the experimental data, and the solid curves represent the fits described in the text. A longitudinal-field measurement taken at 2 K is shown by the blue diamonds. (b) Fast relaxation rate Λ obtained from fits described in the text. The error bars represent the estimated standard deviations of the refined parameters. (c) Weak-transverse-field measurements at various temperatures, offset vertically for clarity. (d) Low-temperature relaxation rate Λ plotted against the ferromagnetic ordering temperature TC for various DMS systems, including the present work, exhibiting a linear relationship with a common slope. The gray dashed line is the best linear fit.

