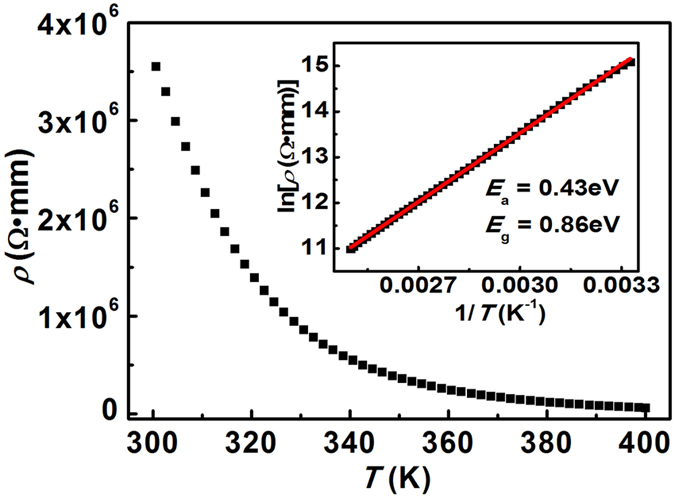
Figure 4. Temperature dependence of resistivity for parent compound BaFZnAs sample.

Inset displays the resistivity of BaFZnAs in the lnρ vs. 1/T plot. The red curve is a fit to ρ(T) = ρ0 exp(Ea/kBT).

Inset displays the resistivity of BaFZnAs in the lnρ vs. 1/T plot. The red curve is a fit to ρ(T) = ρ0 exp(Ea/kBT).