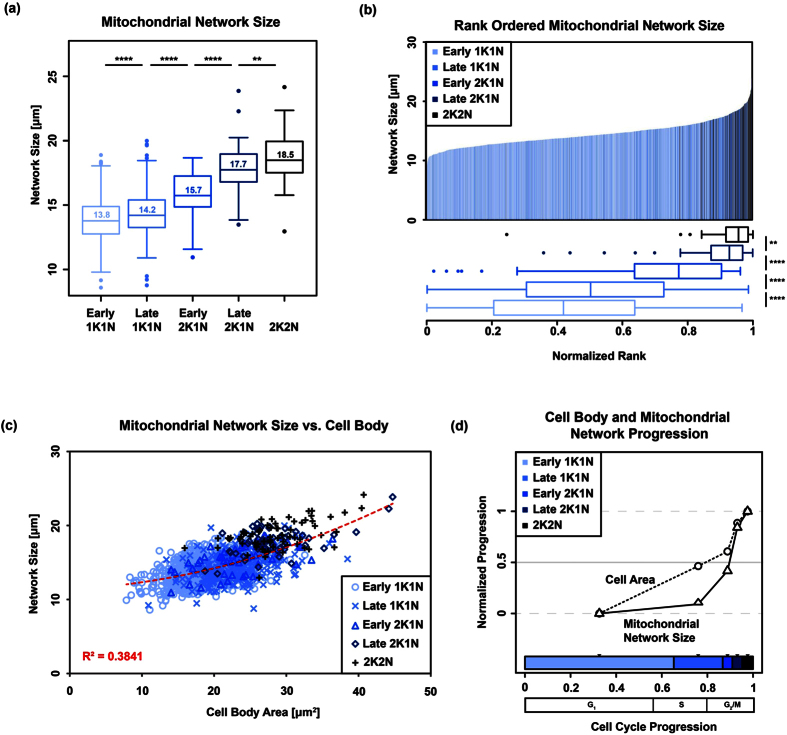
Figure 4. Mitochondrial network size during the cell cycle.
The refined cell cycle stages are depicted in different colours, gradually changing from light blue (early 1K1N) to black (2K2N). (a) Boxplots of the total measured length of the mitochondrial skeleton for each refined cell cycle stage. The displayed numbers inside the boxes represent the median values. (b) The upper part shows a ranked statistic, each bin represents the mitochondrion of a single cell. The rank for each mitochondrion was normalised such that the shortest mitochondrion was assigned the value is 0 and the longest 1. The lower part depicts boxplots of the normalised ranks for each stage. Wilcoxon rank-signed tests were performed from one to the subsequent cell cycle stage. (c) Scatter plot of the cell body area against the total length of the mitochondrial skeleton. Each symbol on the plot represents a single cell. The cells from the refined cell cycle stages were grouped and are depicted in distinct colours and with distinct symbols. A quadratic regression coefficient (R2) for the overall data is shown. (d) Normalised median-values for cell area and mitochondrial network skeleton for the refined cell cycle stages on the y-axis. The values were normalised such that the lowest median value for each of the both measured properties is 0 and the highest is 1. The distances on the x-axis represent the cell cycle progression. The stacked, horizontal bar in the lower part of the plot shows the estimated duration of each cell cycle stage. The midpoints of the calculated cell cycle stages were chosen to place the median values on the y-axis. (****p-value < 0.0001, **0.001 < p-value < 0.01). We also added an estimation of the more conventional cell cycle stage nomenclature (G1, S, G2/M).

