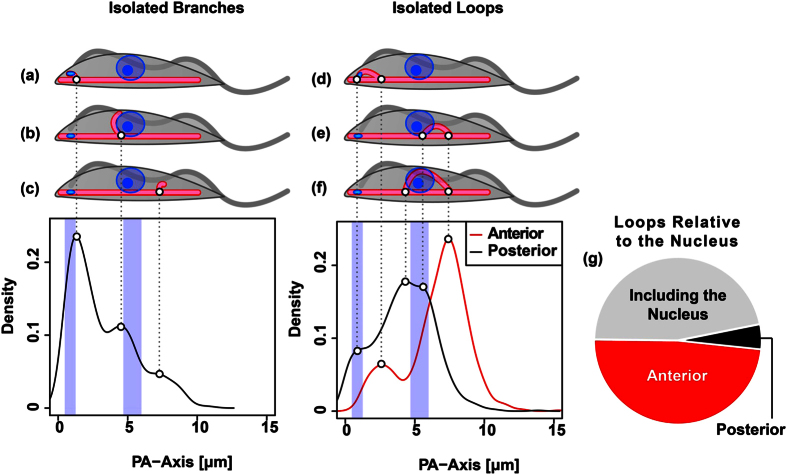
Figure 6. Initial branches and loops.
(a–f) Depiction of hotspots of mitochondrial outgrowth in early 1K1N cells (n = 901). (a–c) Isolated branches can be grouped into three major classes: (a) posterior branches that are found close to the kinetoplast, (b) branches that are found close to the nuclei but slightly posterior to their centre point, and (c) branches emerging from the anterior part of the cell. (d–f) Isolated loops. (d) Loops on the posterior end of the cell that likely include the kinetoplast, (e) loops that are found anterior to the nuclear centre points, (f) and loops that include the centre points of the nuclei. Graphs show the calculated kernel density estimators (KDE) of isolated branches (left) and posterior- and anterior junction points emerging from the mitochondrial main branch (right). The blue vertical bars depict the interquartile ranges (IQR) of the projected centre points of the kinetoplasts (left bar) and the nuclei (right bar). (g) Pie chart shows manual evaluation of the isolated loops relative to the centroids of the nuclei.

