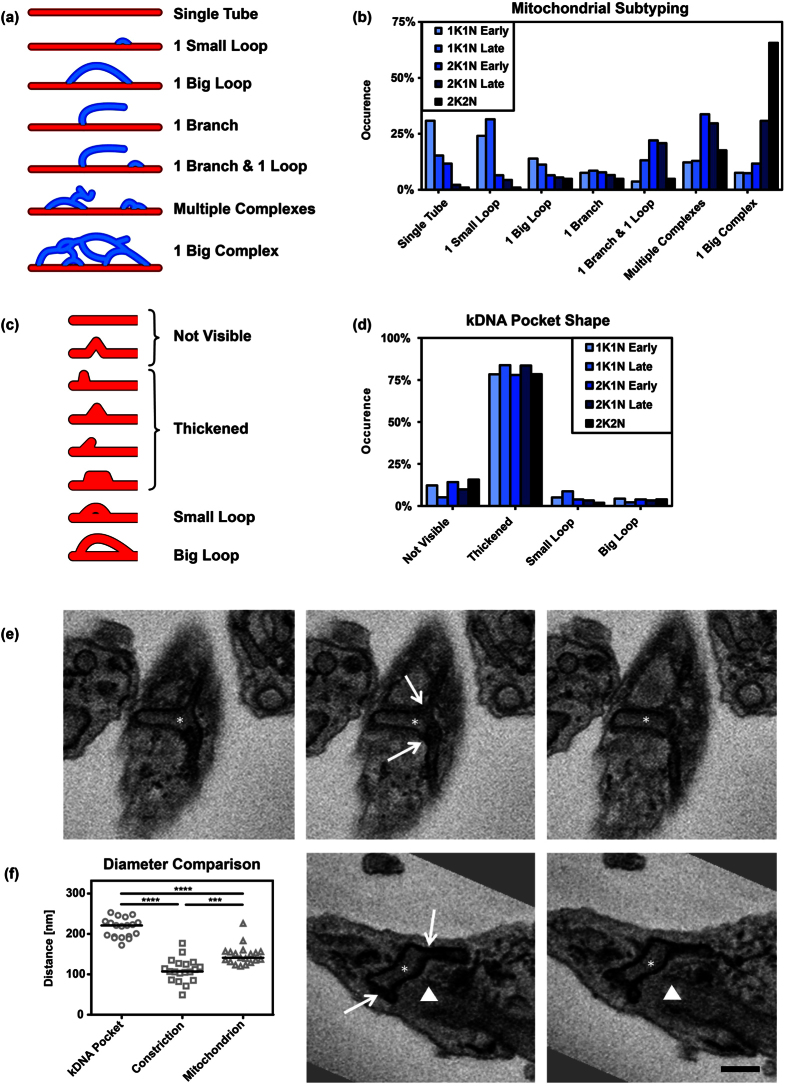
Figure 7. Classification and quantification of mitochondrial morphology subtypes and kDNA.
Mitochondria were grouped into seven distinct classes based on their morphology. (a) Schematic representation of the subtypes. (b) The plots show the relative occurrence within the refined cell cycle stages. (c) Different shapes of the mitochondrion in the region of the kDNA. (d) Bar plot of the occurrence of the different shapes in the distinct cell cycle stages. (e) Serial block face scanning electron microscopy images of BSF trypanosomes. Section of the posterior end of the cell with the kDNA (star) and the basal body (triangle) are shown. Top row shows three successive sections of the kDNA pocket and the constrictions (arrows). Bottom row, two successive sections of the kDNA pocket and the constrictions. (f) Quantification of the average maximum diameter of the kDNA pocket (n = 19, 215 nm ± 23.76 nm), the constrictions (n = 19, 110.15 nm ± 29.32 nm), and random positions in the mitochondrion outside the kDNA pocket (n = 19, 147.63 nm ± 24.64 nm). T-test ***p < 0.005, ****p < 0.0005. Scale bar 500 nm.

