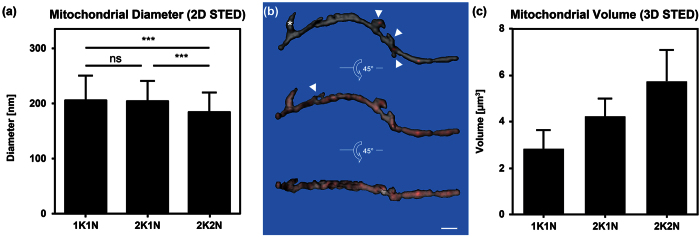
Figure 8. Mitochondrial diameter and size measurements.
(a) The diameter of BSF trypanosome mitochondria measured by 2D STED: 1K1N cells (n = 102, 205.64 nm ± 45.86 nm), 2K1N cells (n = 104, 204.02 nm ± 36.81 nm) and 2K2N cells (n = 107, 184.29 nm ± 36.17 nm); (ns = p-value > 0.05, ***0.0001 < p-value < 0.001; students’ t-test, two-tailed, unpaired). (b) Surface rendering of the mitochondrial volume from a representative 1K1N cell posterior to anterior, left to right. The grey surface is partially transparent to display the maximum intensity projection (red). The 3D reconstruction is turned 45 degrees around the horizontal axis to show the reconstruction in the z axis. Stars mark the kDNA pocket; arrow heads point to mitochondrial branches. Scale bar 1.5 μm. (c) Average mitochondrial volumes calculated from 3D reconstructions (1K1N, n = 13, 2.82 μm3 ± 0.82 μm3; 2K1N, n = 3, 4.21 μm3 ± 0.76 μm3 and 2K2N n = 3, 5.74 μm3 ± 1.35 μm3).

