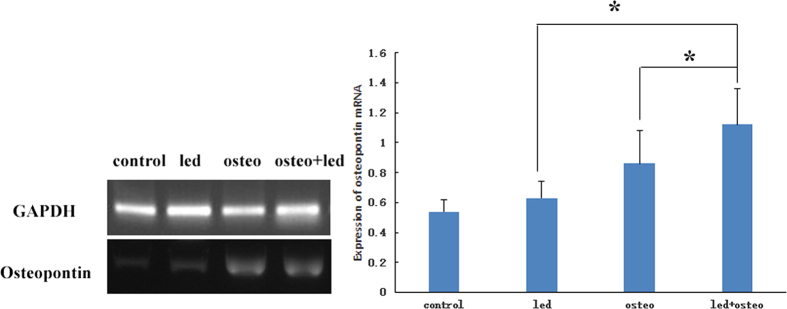
Figure 4. OPN mRNA expression in the hUMSCs of the control group, osteo group, LED group, and LED + osteo group.
Both the osteo group and LED + osteo group demonstrated increased OPN mRNA expression. OPN mRNA expression in the LED + osteo group was significantly higher than those of the control group, LED group and osteo group (p < 0.05).

