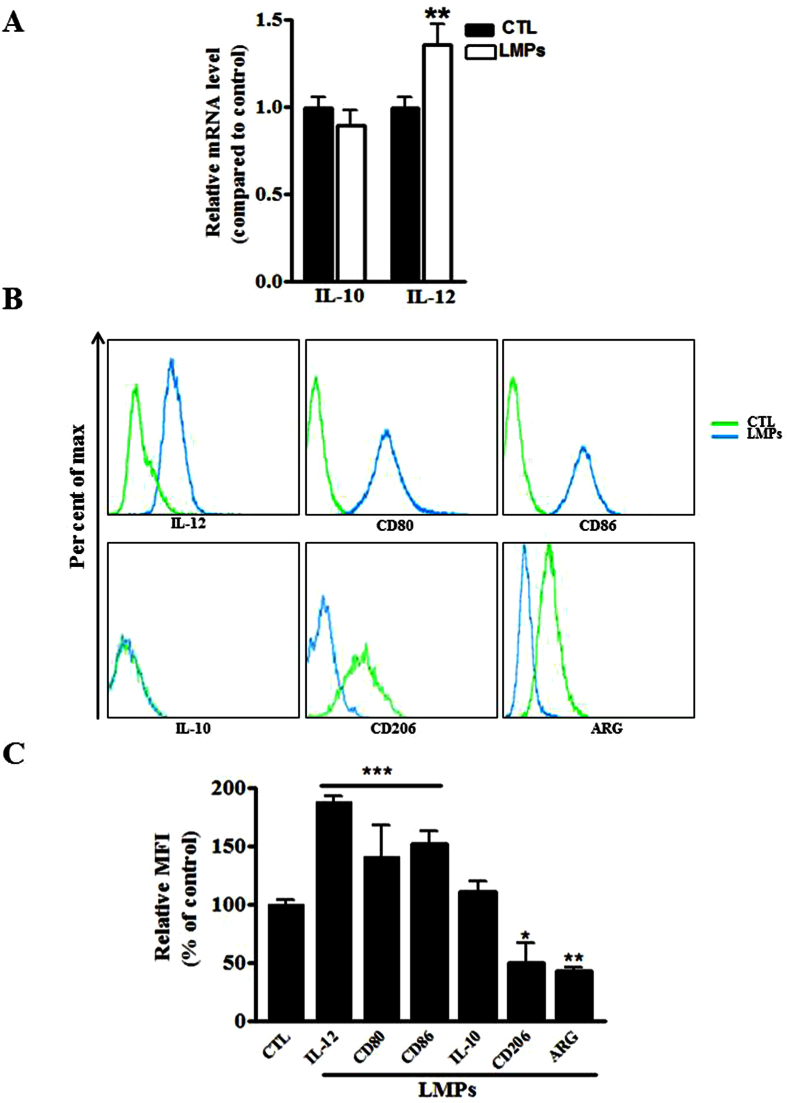
Figure 2. LMPs altered the expression of M1 and M2 markers of macrophages.
(A) The mRNA expression levels of IL-10 and IL-12 were quantified by quantitative RT-PCR after macrophages (RAW 264.7) were treated with 10 μg/mL of LMPs for 24 hours. The values were presented as fold changes relative to the control group (CTL) set as 1. **P < 0.01 vs. CTL (B) Representative FACS analysis of the expression of IL-10, IL-12, CD80, Cd86, ARG, and CD206 in macrophages after 24-hour treatment with 10 μg/mL of LMPs. (C) The numbers of cells expressing of IL-10, IL-12, CD80, CD86, ARG, or CD206 were calculated respectively and presented as a percentage of CTL (set as 100%). ***P < 0.001, **P < 0.01, *P < 0.05 vs. CTL.

