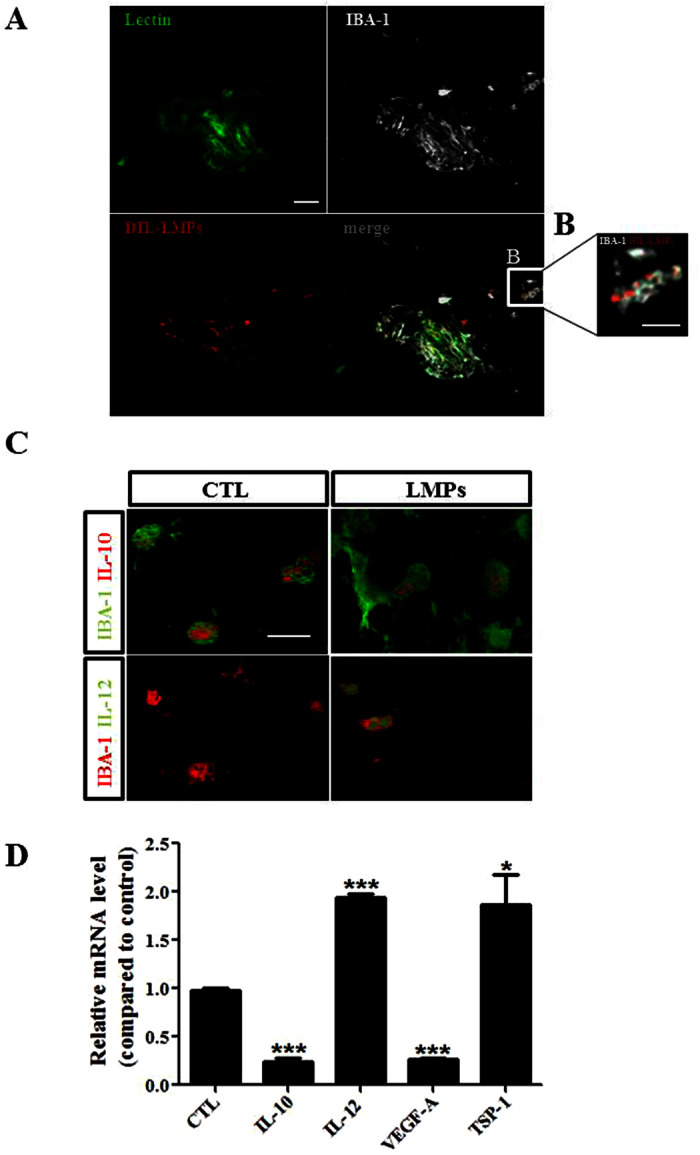
Figure 6. LMPs modulated gene expression in macrophages in vivo.

(A,B) Representative images of LMPs uptake by macrophages in vivo. Immunofluorescence staining of mouse choroidal flat-mounts 7 days after the second intravitreal injections of DiI-LMPs (red) in laser-induced CNV model. The vessels were stained with FITC-lectin (green) and macrophage with IBA-1 in grey. Bar: 50 μm in (A) and 25 μm in (B). (C) Representative images of expression of IL-12 (green) and IL-10 (red) in macrophages in CNV areas after LMPs treatments. Bar: 15 μm. CTL represent the control mice received intravitreal injections of control medium. (D) Relative mRNA expression level of IL-10, IL-12, VEGFa and TSP-1 in CNV areas. Tissues from the CNV areas were collected by laser-capture microdissection. The mRNA levels of the genes of interest were quantified by quantitative RT-PCR. The values were presented as mean fold changes relative to the control (CTL) values (set as 1). *P < 0.05, ***P < 0.001 vs. CTL.
