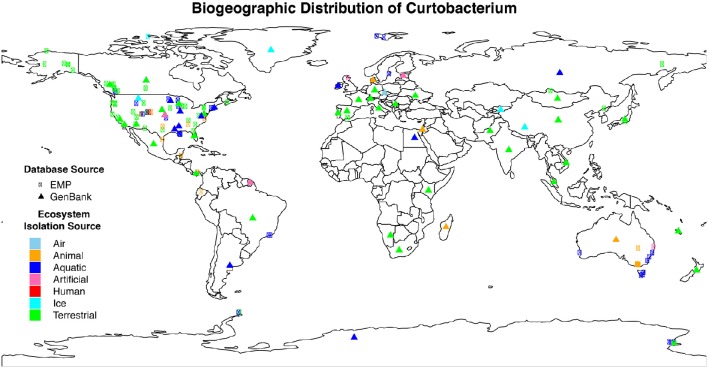
Figure 1.
Geographic distribution of Curtobacterium compiled from various isolation sources. Colors indicate the different ecosystems from which the sequence was isolated. The symbol shape indicates the dataset from which the sequence originated. Sequences obtained from GenBank (triangle symbols) were mostly approximations as detailed GPS coordinates were not available.

