Figure 5.

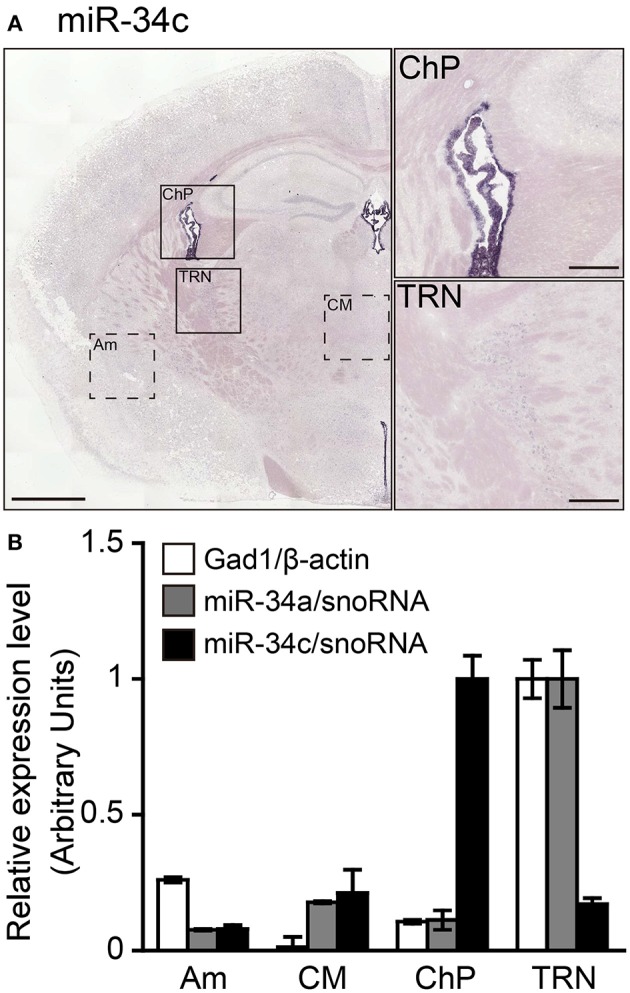
Validation of the specificity of the ISH signals detected. Sections including the TRN were hybridized using LNA-modified probes against miR-34c to test the specificity of the miR-34a ISH signal. ISH of miR-34c was performed in fresh samples treated with 1 μg/mL proteinase K. miR-34c probes were hybridized at 37° or 49°C below the Tm-value, followed by washing with 50% formamide in 1 × SSC. (A) ISH signal of miR-34c is shown. The brain regions including the ChP or TRN in (A) are magnified in the right-hand panels. Scale bars, 1 mm; 0.2 mm in magnified images. (B) Relative expression levels of Gad1 (white bars), miR-34a (gray bars), and miR-34c (black bars) are shown in the brain regions, including the Am, CM, ChP, or TRN, which are shown as the dotted boxed areas or boxed areas in (A). The expression levels of mRNA and miRNA were normalized to β-actin and snoRNA, respectively. Data are presented as the means ± SEM of three brains.
