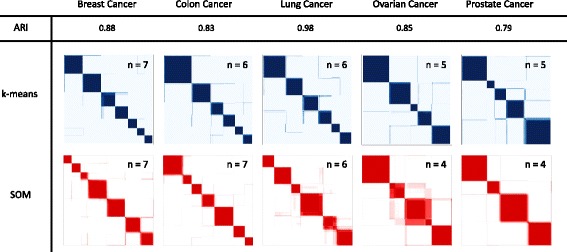
Fig. 1.

Consensus clustering heatmaps and adjusted Rand index. Consensus matrices are represented as color coded heatmaps. Each entry in the matrix is between 0 and 1, thus we associate a color gradient to the (0,1) range of real number. For k-means algorithm 0 = white and 1 = blue, while for SOM 0 = white and 1 = red. A matrix corresponding to perfect consensus is displayed as a color-coded heatmap characterized by blue/red blocks along the diagonal. Numbers inside of each heatmap represent number of clusters selected for each algorithm and dataset. Adjusted Rand index (ARI) is also shown, which measures the agreement between two clustering algorithms with 1 corresponding to perfect agreement. High values for ARI indicate high level of agreement
