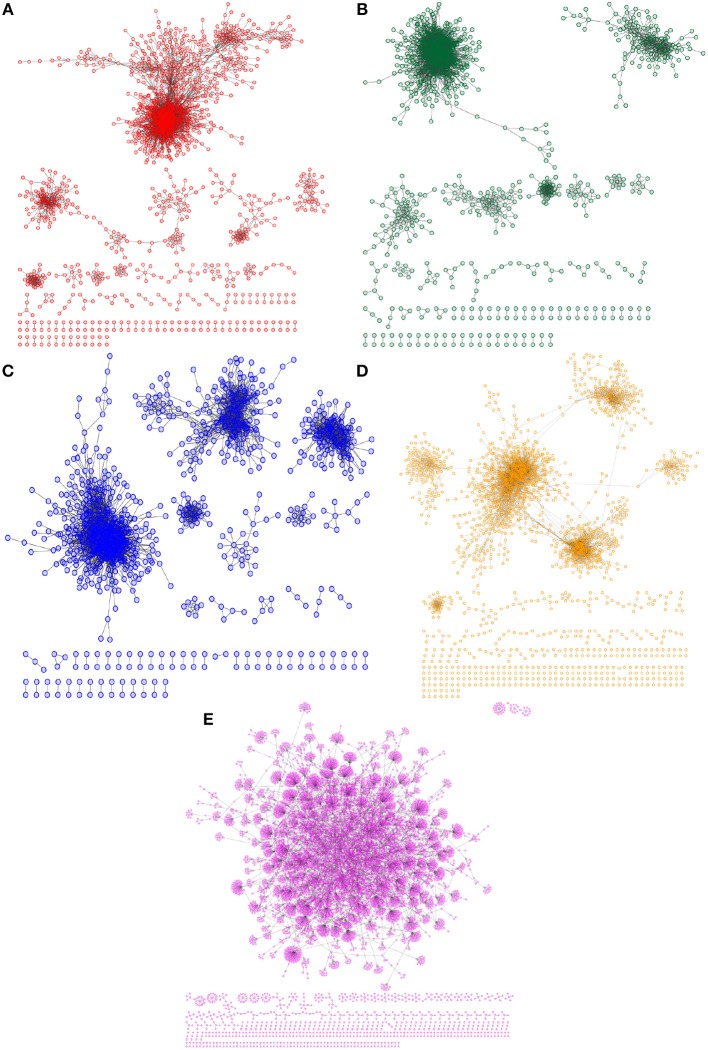
Figure 1.
Network architectures for breast cancer subtypes and non-tumor breast tissue. In each panel, the transcriptional network structure of each breast tumor subtype is shown: (A) Luminal A (red nodes); (B) Luminal B (green); (C) Basal (blue) (D) and HER2-enriched molecular subtype (orange). (E) Shows the transcriptional architecture for non-tumor breast tissue. Please notice the that (A–D) show networks with a large component and multiple medium-sized components, while (E) presents a network dominated by a single giant component, followed by small components.

