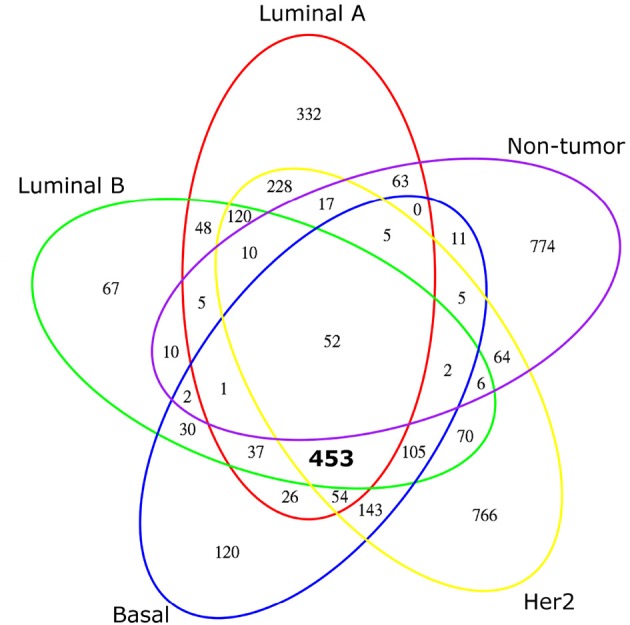
Figure 2.

Venn diagram of network node composition. A five-set Venn diagram of the nodes that form each transcriptional network: Luminal A is outlined in red, Luminal B in green, Basal in blue, HER2-enriched in yellow and non-tumor breast tissue in purple. Numbers in graph represent how many genes belong to each subset. Notice that the intersection of the four breast cancer molecular subtypes is large (453, marked in bold); meanwhile the number of shared genes between tumor and non-tumor networks is much smaller, with only 52 genes shared by all networks.
