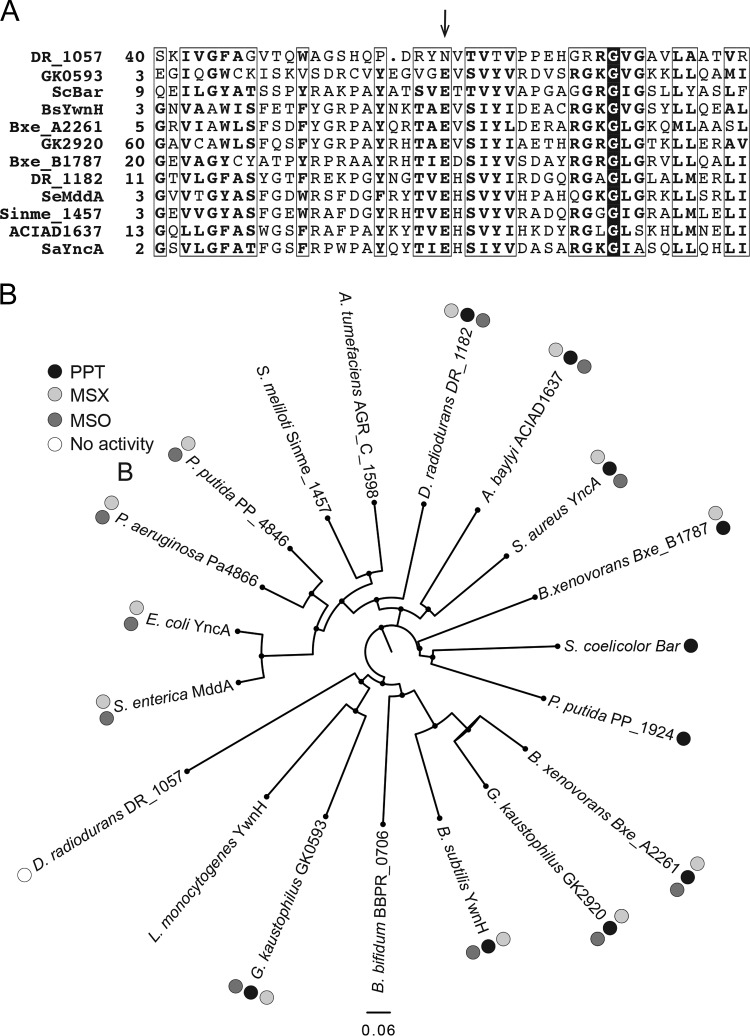
FIG 6.
Bioinformatics analyses of annotated PPT acetyltransferases. (A) Alignments were generated using the NCBI COBALT multiple alignment tool. The arrow points at the predicted active-site glutamate of acetyltransferases. Numbers on the left of the sequences indicate the location of the first residue in the native protein; boxed residues show regions of at least 70% similarity; a conserved glycyl residue is identified by white letters in a black background. (B) A phylogenetic tree of 19 annotated PPT acetyltransferases was generated using FigTree software (http://tree.bio.ed.ac.uk/software/figtree/). For DR_1057, only the sequence of the GNAT domain that aligned to the other putative PPT acetyltransferases (residues 1 to 180) was used for the phylogenetic tree. When gene names were unavailable, locus tags were used (i.e., for P. putida, PP_1924); 0.06 designates the scale for tree length.

