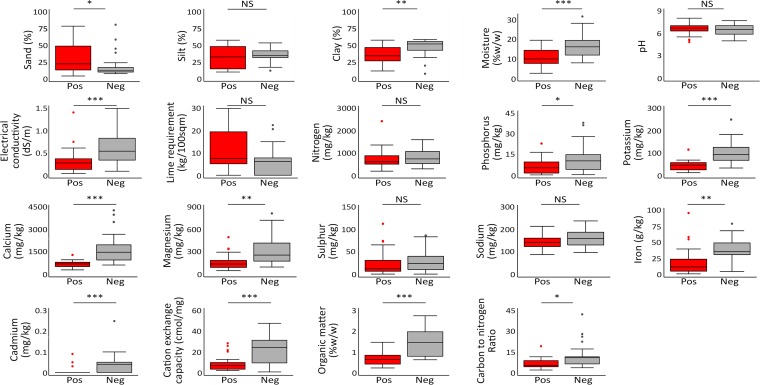
FIG 2.
Soil physicochemical properties associated with the presence of B. pseudomallei. Box-and-whisker plots indicate median, interquartile range, and distribution of the data. Dots indicate the outliers (data located outside 1.5 times of interquartile range) (41). Red and gray boxes represent rice fields that are culture positive (Pos) and culture negative (Neg) for B. pseudomallei, respectively. *, P ≤ 0.05; **, P ≤ 0.01; ***, P ≤ 0.001. NS, not significant.

